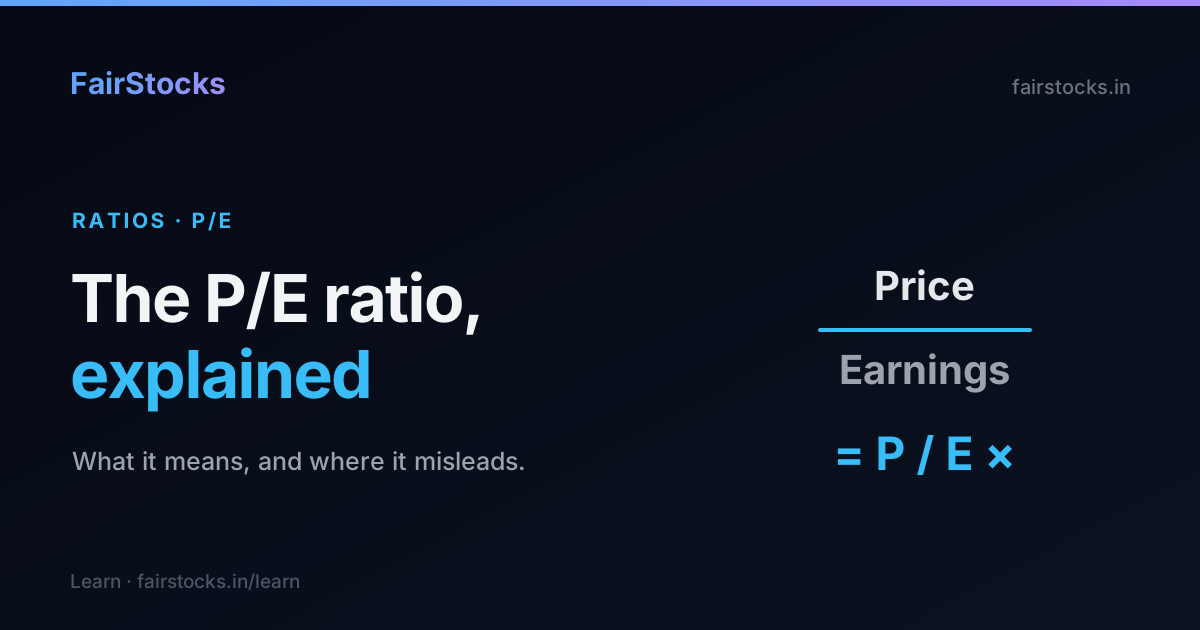
The price-to-earnings ratio is the first number most people learn and the most widely misused. It is not a measure of whether a stock is cheap — it is a measure of what the market expects. This guide explains what the P/E actually tells you, what "normal" looks like across Indian sectors, and the traps that make a low P/E dangerous and a high P/E worth paying.
What the P/E ratio actually is
The price-to-earnings ratio answers one question: for every rupee of annual profit the company earns, how many rupees are investors paying?
\[\text{P/E} = \frac{\text{Share Price}}{\text{Earnings Per Share (EPS)}}\]
If a stock trades at ₹500 and earned ₹25 per share over the last year, its P/E is 20. You are paying ₹20 for every ₹1 of current annual profit.
There is a second, more intuitive way to read the same number. Flip it upside down and you get the earnings yield:
\[\text{Earnings Yield} = \frac{1}{\text{P/E}} = \frac{\text{EPS}}{\text{Price}}\]
A P/E of 20 is an earnings yield of 5%. That single reframing is the most useful thing to internalise about the ratio: a P/E of 20 means the business, at today's profit level, earns back 5% of your purchase price each year. A P/E of 10 is a 10% yield; a P/E of 50 is a 2% yield. Suddenly you can compare a stock against a fixed deposit or a bond, and the "high P/E" and "low P/E" labels start to mean something concrete.
Why P/E is really a forecast in disguise
Here is the point almost every beginner misses. The P/E looks backward — it uses profits that have already happened — but the price in the numerator is set by the market's view of the future. So the ratio is not a fact about value; it is the market's forecast, compressed into one number.
A high P/E is the market saying "earnings will grow." A low P/E is the market saying "earnings will fall, or at best stay flat."
This is why "buy low P/E stocks" is not a strategy — it is a starting question. The real work is deciding whether the market's implied forecast is wrong. A low P/E is only an opportunity if you believe earnings will hold up better than the pessimism priced in. A high P/E is only a bargain if the growth arrives.
If you want to see this forecast made explicit — the exact growth rate the current price is baked on — that is what a reverse discounted cash flow does, and it is the logic behind the "market expects" figure FairStocks shows on every valuation.
Trailing vs forward P/E
You will see two versions quoted, and confusing them causes real mistakes:
| Trailing P/E | Forward P/E | |
|---|---|---|
| Earnings used | Actual, last 12 months | Estimated, next 12 months |
| Reliability | Factual — already reported | Depends on forecasts |
| Best for | Stable, predictable businesses | Companies with a known earnings change coming |
| Weakness | Ignores the future entirely | Analysts are routinely too optimistic |
The gap between them is a signal in itself. If a company trades at a trailing P/E of 40 but a forward P/E of 22, the market expects profits to grow roughly 80% over the next year. That might be a factory coming online, a turnaround, or wishful thinking — the point is you should go and find out why the two numbers disagree before you rely on the cheaper one.
What's a "good" P/E in India? Sector benchmarks
There is no universal good number, and any article that gives you one is selling you something. A P/E only means anything relative to three things: the company's own history, its direct peers, and its growth rate. As a frame of reference, here is roughly how different parts of the Indian market are typically priced:
| Sector | Typical P/E range | Why |
|---|---|---|
| FMCG / Consumer staples | 45 – 70 | Extremely predictable earnings, strong brands, high return on capital |
| IT services | 22 – 32 | Steady growth, asset-light, dollar earnings |
| Private banks | 15 – 25 | Structural credit growth; P/B often more useful |
| Public-sector banks | 6 – 12 | Lower returns, cyclical credit costs |
| Autos | 18 – 30 | Cyclical demand, but strong franchises |
| Metals & mining | 6 – 12 | Deeply cyclical commodity prices |
| Cement | 20 – 35 | Cyclical, but consolidation supports pricing |
| Pharma | 25 – 40 | Mixed — depends on domestic vs US exposure |
These are broad, illustrative ranges, not live figures — they shift with the market cycle. Use them to understand why a number is high or low, never as a target to buy or sell against.
The takeaway: a cement company at a P/E of 10 is not automatically cheaper than an FMCG company at 55. They are different businesses with different durability of earnings, and the market prices that durability. The FMCG name might genuinely be the better value despite five times the multiple.
The value trap: why a low P/E can be the most expensive stock
The single most costly misuse of the P/E is buying cyclicals when they look cheapest. A steel, sugar, or shipping company shows its lowest P/E at the top of its cycle — the exact moment before earnings collapse.
Here is why. Suppose a metals company earns ₹80 per share at the peak of a commodity boom, and the stock trades at ₹640. That is a P/E of 8 — it screams "cheap." But commodity prices then normalise, next year's earnings fall to ₹20, and the same ₹640 price is now a P/E of 32. The stock didn't get expensive; the earnings fell out from under it. Investors who bought the low P/E were buying peak profits that were never going to last.
For cyclical businesses, the P/E is most dangerous exactly when it looks most attractive. A low trailing P/E on a cyclical often marks the top, not a bargain.
The defence is to ask, every time you see a tempting low P/E: are these earnings normal, or are they peak? For a cyclical, average the earnings across a full cycle before you divide.
When the P/E doesn't work at all
The ratio breaks entirely in three situations:
- Loss-making or barely-profitable companies. With negative earnings the P/E is negative and meaningless; with tiny earnings it is enormous. A young company investing heavily for growth can be genuinely valuable and still have no usable P/E. Here you need price-to-sales, EV/EBITDA, or a model that projects the company forward to profitability rather than judging it on today's suppressed profit.
- Banks and lenders. P/E works, but a bank's business is its balance sheet, so price-to-book (P/B) paired with return on equity usually tells you more. A bank earning 18% on equity deserves a higher P/B than one earning 9%.
- Companies with distorted one-off earnings. A large asset sale, an insurance payout, or a tax write-back can inflate or crush a single year's EPS, throwing the P/E off. Always check whether the "E" is a clean, repeatable number.
A quick sanity check: the PEG ratio
Because a high P/E can be perfectly justified by high growth, one popular adjustment is the PEG ratio, which divides the P/E by the expected earnings growth rate:
\[\text{PEG} = \frac{\text{P/E}}{\text{Earnings Growth Rate (\%)}}\]
A company on a P/E of 30 growing earnings at 30% a year has a PEG of 1.0. As a rough convention, a PEG near 1 is considered fair, below 1 potentially cheap, and well above 1 expensive for the growth on offer. It is a handy sanity check — it stops you dismissing a great compounder just because its P/E looks high — but treat it as a rule of thumb, not a valuation. It leans on a single growth estimate and ignores risk, debt, and how many years that growth can realistically continue.
How to actually use the P/E ratio
Put together, the P/E is a fast, powerful first filter — as long as you use it as a question rather than an answer:
- Flip it to a yield. A P/E of 25 is a 4% earnings yield. Is that enough for the growth and risk you are taking?
- Compare like with like. Judge the number against the company's own five-year history and its two or three closest listed peers — never against the market as a whole.
- Check whether earnings are normal or peak. Especially for anything cyclical.
- Ask what growth the multiple implies. Then decide whether you believe it.
- Never stop at the P/E. It is one lens. Return on capital, debt, cash conversion, and a proper intrinsic-value estimate are what turn a screen into a decision.
The P/E tells you what the market expects. The job of an investor is to work out, independently, what the business is actually worth — and then compare. That second number is the intrinsic value of the stock, and it is where the real edge is.