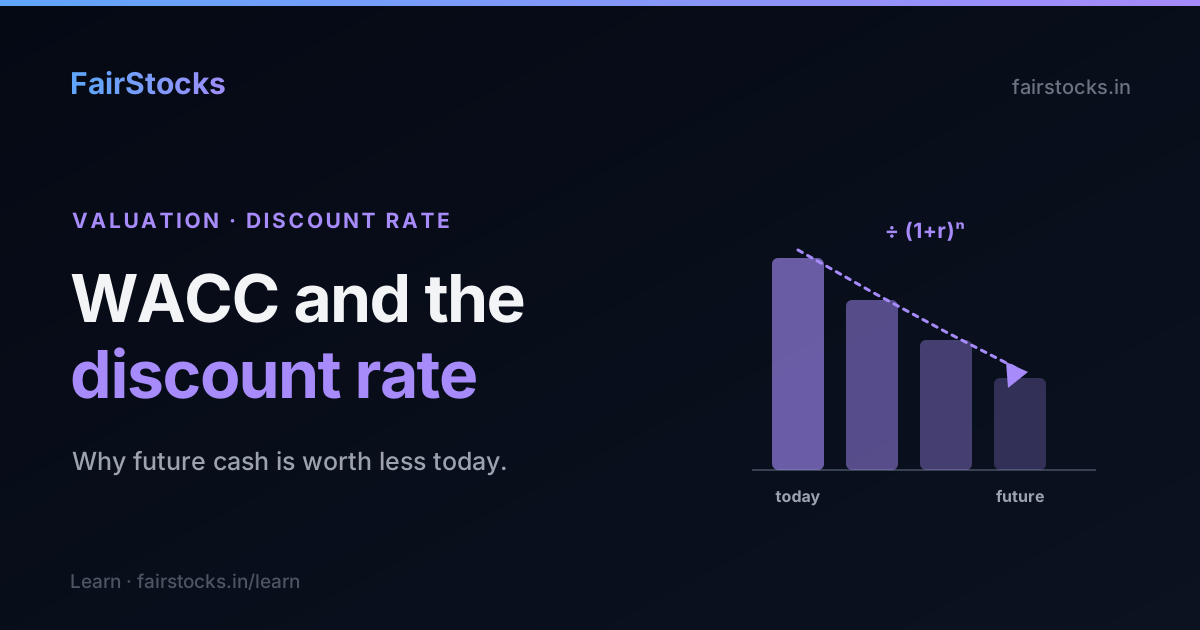
The discount rate is the most powerful number in any valuation, and the one most people never really understand. Move it a point or two and a stock's fair value can swing by a fifth. This guide explains what a discount rate is, why future cash is worth less than cash today, how WACC is built from the cost of equity and debt, and what a sensible rate looks like for an Indian company.
Why a rupee tomorrow is worth less than a rupee today
Start with the simplest question: would you rather have ₹100 now or ₹100 a year from now?
Obviously now. You could invest it, so it would grow; prices may rise, so it will buy less later; and the future ₹100 is not even certain to arrive. Those three forces — the time value of money, inflation, and risk — all point the same way: money in the future is worth less than money today.
A discount rate is simply the annual rate that measures how much less. If the right rate is 12%, then ₹112 a year from now is worth about ₹100 today, because ₹100 invested at 12% would grow to ₹112. Run that backwards over many years and you can take all the cash a business is expected to produce in the future and express it as a single number: what it is worth today.
\[\text{Value today} = \frac{\text{Future cash flow}}{(1 + r)^{n}}\]
Here $r$ is the discount rate and $n$ is the number of years away. The higher the rate, the harder future rupees are discounted, and the lower today's value. This one equation is the engine inside every discounted cash flow.
The discount rate is the exchange rate between the future and the present. A higher rate makes tomorrow's money worth less today — and the whole company worth less.
Where the rate comes from: WACC
So what number should $r$ be? For most companies, the answer is the weighted average cost of capital, or WACC.
The logic is this. A company is funded by two kinds of people: shareholders, who own equity, and lenders, who provide debt. Each group demands a return for handing over their money. WACC is the blended return the company must earn to keep both groups satisfied, weighted by how much of each it uses:
\[\text{WACC} = \left(\frac{E}{E+D}\right) K_e + \left(\frac{D}{E+D}\right) K_d (1 - t)\]
It looks heavy, but it says something simple:
- $K_e$ is the cost of equity — the return shareholders require.
- $K_d$ is the cost of debt — the interest rate on borrowings. It is multiplied by $(1-t)$ because interest is tax-deductible, so debt is a little cheaper than its headline rate.
- The two are weighted by the share of equity ($E$) and debt ($D$) in the company's funding.
WACC is the minimum return the business must earn on its capital to create value. Earn more than WACC and it builds wealth; earn less and it destroys wealth even while reporting a profit.
The hard part: the cost of equity
The cost of debt is easy — it is roughly the interest rate the company pays. The cost of equity is subtler, because shareholders never state the return they require; it has to be estimated. The standard tool is the Capital Asset Pricing Model (CAPM):
\[K_e = R_f + \beta \times \text{ERP}\]
- $R_f$ is the risk-free rate — the return on a safe government bond. In India that is anchored to the ten-year government security yield, historically around 7%.
- ERP is the equity risk premium — the extra return investors demand for the risk of holding shares over that safe bond, usually a few percentage points.
- $\beta$ (beta) measures how much the stock swings relative to the market. A beta above 1 means it is more volatile than the market and so requires a higher return; below 1, less.
Put together, the cost of equity for a typical Indian company lands somewhere in the low-to-mid teens — and because equity is usually the largest slice of funding, it does most of the work in setting WACC.
What a sensible rate looks like in India
There is no single correct WACC, but there is a sensible range. For a typical Indian company it often sits around 11-14%, built from:
- a risk-free rate near the ten-year government bond yield (historically ~7%),
- an equity risk premium of a few points on top,
- and an adjustment for the specific company's risk — its volatility, its debt, how predictable its cash flows are.
Where a company falls in that range says a lot:
- Stable, cash-rich, low-debt businesses — a consumer-staples or large IT company — sit at the lower end. Their future is more certain, so investors discount it less harshly.
- Cyclical, leveraged or smaller companies sit higher, because their future cash is riskier and demands a steeper discount.
Why one percentage point changes everything
Here is what makes the discount rate the most consequential number in a valuation: it is applied to every future year, and its effect compounds. A large share of a company's value usually sits in its terminal value — the cash it earns far into the future — and that is exactly where a higher discount rate bites hardest.
The practical result is that moving WACC by a single percentage point can swing a fair value by 15-20% or more. A stock that looks cheap at a 12% discount rate can look fully priced at 13%. That sensitivity is not a flaw in the method — it is the honest reflection of how much the price of risk matters. It does, however, mean two things:
The discount rate deserves more scrutiny than any other input. And any valuation that hides the rate it used, or shows no sensitivity to it, is asking for blind trust it has not earned.
This is why a valuation should always make the discount rate visible, and show how the answer moves as the rate changes, rather than reducing everything to one confident-looking number.
The one exception: banks
WACC is the right discount rate for almost every company — but not for a bank. For a lender, debt is not a financing choice sitting outside the business; it is the raw material of the business. That breaks the enterprise-value framework WACC belongs to, so banks are valued on the return they earn on equity against the cost of equity alone. If you are looking at a financial stock, see how to value a bank instead — the discount-rate logic here applies to everything else.
See the rate behind the value
A discount rate should never be a black box. FairStocks builds a WACC for each company from its own cost of equity and debt, uses it to discount a decade of projected free cash flow, and shows the rate it used alongside the resulting fair value — so you can see not just what a company is worth, but the price of risk that produced the number.
Get the discount rate right and the rest of a valuation follows. Get it wrong — or ignore it — and even the most careful cash-flow forecast in the world will point you to the wrong answer.