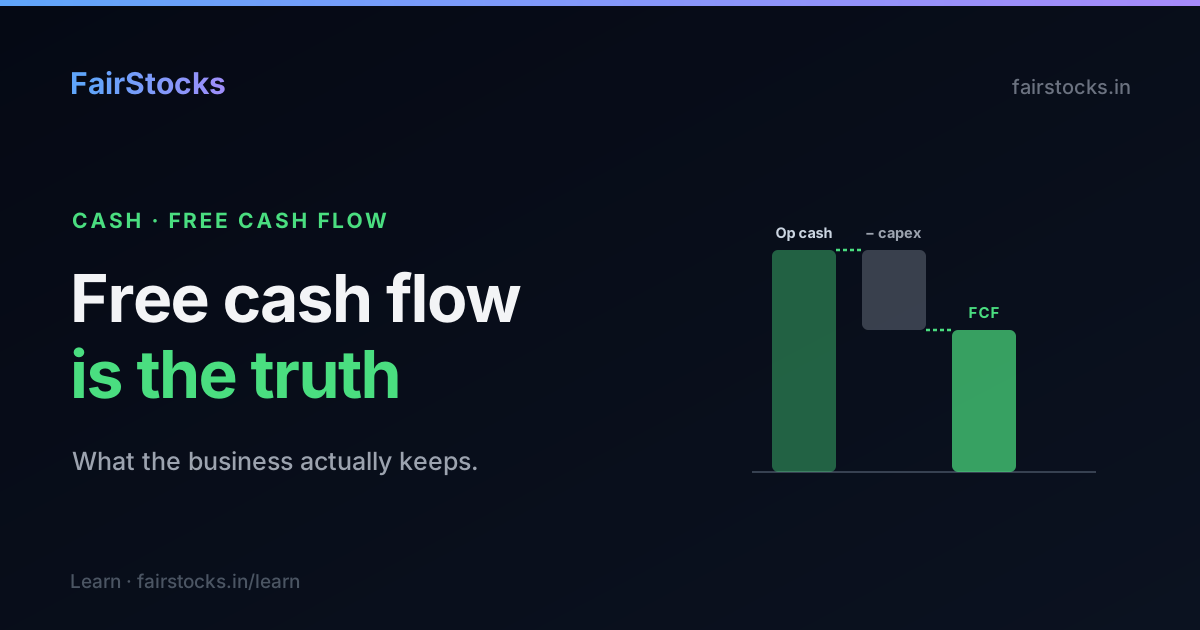
Profit is an opinion; cash is a fact. Reported earnings can be shaped by depreciation schedules, revenue timing and non-cash gains, but free cash flow is the money that actually accumulates in the business after the bills and the investment are paid. It is what funds dividends, buybacks and debt repayment — and it is the number a discounted cash flow model discounts to arrive at value. This guide explains what free cash flow is, how to build it, the difference between FCFF and FCFE, and the traps it exposes.
Why cash, not profit
Start with the uncomfortable truth every experienced investor learns eventually: a company can report a profit and still be quietly running out of money.
Net profit is calculated on the accrual basis. A sale is booked when the invoice is raised, not when the customer pays. A cost is recognised when it is incurred, not when the cash leaves. Depreciation subtracts a slice of an asset bought years ago, even though no cash moves this year. Every one of those is a legitimate accounting rule — and every one of them opens a gap between the profit on the income statement and the cash in the bank.
Free cash flow closes that gap. It ignores accounting opinions and asks a single blunt question:
After paying to run the business and to keep its assets standing, how much cash is genuinely left for the people who own and fund it?
That leftover cash is the only thing a company can actually do something with. You cannot pay a dividend out of accrued profit. You cannot repay a loan with a depreciation add-back. You can only do those things with free cash flow.
The simplest definition
At its most usable, free cash flow is two lines from the cash-flow statement:
\[\text{Free Cash Flow} = \text{Cash Flow from Operations} - \text{Capital Expenditure}\]
- Cash flow from operations (CFO) is the cash the business actually collected from running its operations, after adjusting for working capital — inventory built up, receivables not yet collected, payables not yet paid. It already strips out the non-cash charges like depreciation.
- Capital expenditure (capex) is the cash spent on property, plant, equipment and other long-lived assets — the investment needed to keep the business running and to grow it.
Both numbers come straight off the cash-flow statement, which is the least massaged of the three financial statements precisely because it tracks money that moved. Subtract one from the other and you have the cash the business threw off and did not have to plough straight back into its own machinery.
FCFF and FCFE — the two precise versions
The simple formula is fine for a quick read, but valuation needs to be careful about whose cash it is measuring. That is the difference between the two formal definitions.
Free cash flow to the firm (FCFF)
FCFF is the cash available to everyone who funds the business — both lenders and shareholders — measured before interest is paid. It is built up from net profit:
\[\text{FCFF} = \text{Net Profit} + \text{Non-cash charges} + \text{Interest} \times (1 - \text{tax}) - \text{Capex} - \Delta\text{Working Capital}\]
Interest is added back (net of the tax it saves) because FCFF describes the cash before it is split between lenders and owners. This is the number a standard DCF discounts — at the weighted average cost of capital — to reach the value of the whole enterprise. Subtract net debt from that, and you have the equity value.
Free cash flow to equity (FCFE)
FCFE is what is left for shareholders alone, after the lenders have been served:
\[\text{FCFE} = \text{FCFF} - \text{Interest} \times (1 - \text{tax}) + \text{Net Borrowing}\]
Or, from the top: operating cash flow, minus capex, minus net interest, plus any new debt raised. FCFE is discounted at the cost of equity and gives the equity value directly, without the debt-subtraction step.
| FCFF | FCFE | |
|---|---|---|
| Cash belongs to | Lenders + shareholders | Shareholders only |
| Measured | Before interest | After interest & debt flows |
| Discount rate | WACC | Cost of equity |
| Gives you | Enterprise value | Equity value directly |
| Best when | Debt is changing or complex | Debt is stable and modest |
Most practitioners value the firm with FCFF and then subtract debt, because it keeps the operating business and the financing decisions cleanly separated — the same logic that makes EV/EBITDA a fairer comparison than the P/E.
A worked example
Take a company that reports these figures for the year (₹ crore):
| Line | Amount |
|---|---|
| Net profit | 600 |
| Depreciation & amortisation | 250 |
| Increase in working capital | 120 |
| Capital expenditure | 300 |
| Interest paid | 90 |
| Tax rate | 25% |
Cash flow from operations ≈ net profit + D&A − increase in working capital = 600 + 250 − 120 = ₹730 crore.
Simple free cash flow = CFO − capex = 730 − 300 = ₹430 crore.
FCFF = 730 + interest × (1 − tax) − capex = 730 + 90 × 0.75 − 300 = 730 + 67.5 − 300 = ₹497.5 crore (it adds interest back because FCFF is pre-financing).
So this business converts ₹600 crore of reported profit into roughly ₹430 crore of usable free cash — a conversion of about 72%. That ratio, cash flow divided by profit, is one of the most revealing numbers in all of analysis.
Cash conversion: the quality test
A high-quality business turns most of its reported profit into real cash, year after year. A weak one reports profit that never quite shows up in the bank. The ratio to watch:
\[\text{Cash Conversion} = \frac{\text{Free Cash Flow}}{\text{Net Profit}}\]
Sustained conversion near or above 100% is the hallmark of a genuinely cash-generative business — often one with strong pricing power, light working-capital needs and modest maintenance capex. Chronically low conversion is a red flag that deserves a specific explanation:
- Profit rising but cash flat or falling? Check whether receivables and inventory are ballooning — the company may be booking sales it has not been paid for, or building stock it cannot sell.
- Capex persistently swallowing all of operating cash? The business may be capital-hungry just to stand still — the very trap EV/EBITDA hides by adding depreciation back.
- One-off non-cash gains flattering profit? Revaluations and fair-value gains lift the bottom line without producing a rupee of cash.
A company that reports growing profits but stagnant free cash flow is telling you something the income statement is trying to hide. Believe the cash.
Owner earnings: Buffett's refinement
Warren Buffett proposed a sharper version he calls owner earnings — an attempt to capture the cash a shareholder could genuinely withdraw each year without weakening the business:
\[\text{Owner Earnings} = \text{Net Profit} + \text{Non-cash charges} - \text{Maintenance Capex}\]
The subtle, powerful idea is the word maintenance. Total capex mixes two very different things: the spending needed just to keep the existing business running (maintenance), and the spending that expands it (growth). Only the first is a true cost of staying in business; the second is a discretionary investment that should earn a return.
A company spending ₹300 crore of capex where only ₹120 crore is maintenance is far more valuable than the raw free-cash-flow number suggests — because ₹180 crore of that spending is optional growth investment, not a survival cost. Separating the two is difficult and somewhat judgemental, which is exactly why it is where careful analysis earns its edge.
When negative free cash flow is fine — and when it is not
Negative free cash flow is not automatically a warning. A young company building capacity ahead of demand — a manufacturer commissioning a new plant, a retailer opening stores — will spend more than it earns for a while, by design. If that investment earns high returns on capital, it is value-creating, and the negative FCF is an investment, not a leak.
It becomes a problem when it is:
- Chronic — negative for years with no path to turning positive;
- Debt-funded — plugged by ever-rising borrowings rather than by the growth it was meant to produce; and
- Unproductive — the spending is not translating into the revenue and margin that were supposed to justify it.
The test is always the same: is the cash being spent buying a durable increase in future cash flows? If yes, patience. If no, the business is consuming capital, and the market will eventually price it accordingly — the mechanism behind why a stock becomes overvalued or undervalued.
Why this is the number that matters
Every serious valuation method eventually reduces to free cash flow. A DCF discounts projected free cash flows to today. Intrinsic value is, formally, the present value of all the cash a business will ever produce for its owners. Even the multiples — P/E and EV/EBITDA — are shorthand approximations for what a full cash-flow model would say.
That is why free cash flow, not reported profit, is the ground truth of value. Profit tells you what the accountants concluded; free cash flow tells you what the business actually produced. FairStocks rebuilds free cash flow — operating cash, capex, working capital and all — for any listed Indian company straight from its filed statements, and shows the cash conversion and the assumptions behind every rupee of the valuation it produces.