LARSEN & TOUBRO valuation — what today's price assumes
Ten years of LARSEN & TOUBRO (LT)'s results, the ratios that matter for this business, and the growth and returns today's share price already implies — all built from its filed accounts.
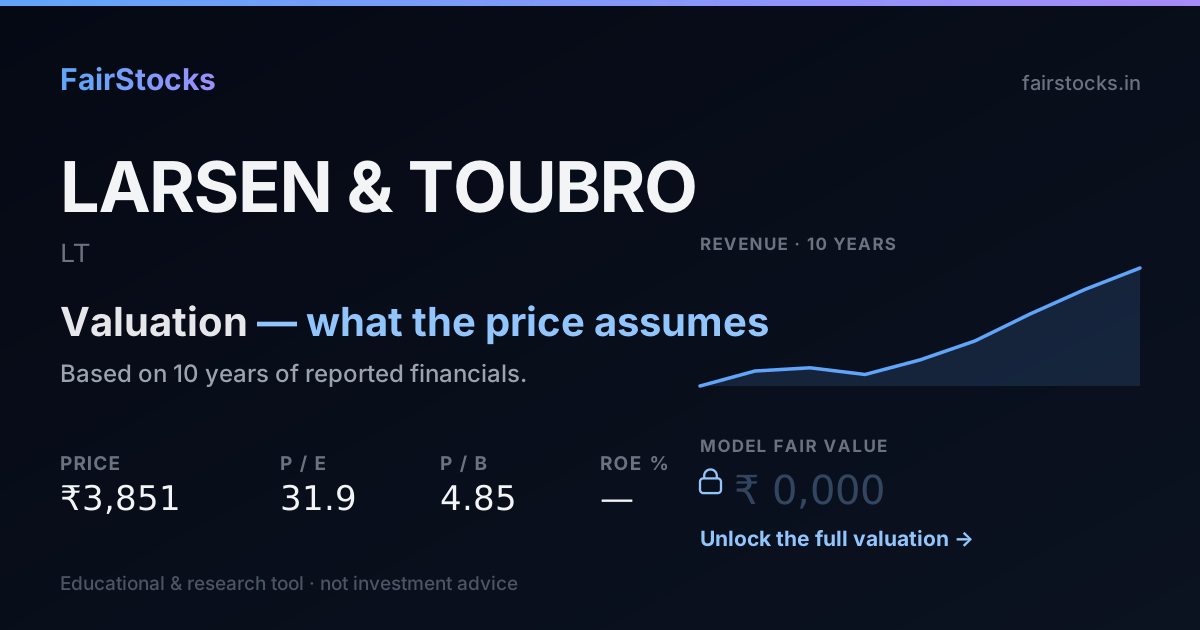
We do not publish one number for LARSEN & TOUBRO — and here is why.
LARSEN & TOUBRO is really several different businesses under one roof, and they do not work the same way. Adding them together into a single “fair value” would produce a figure that describes none of them. So we value each part on its own terms instead of printing one number that looks tidy and means little.
What the market is assuming
Worked backwards from today's share price: the growth today’s price implies for LARSEN & TOUBRO, against what the model assumes.
How to read this. The number on the left is the growth today’s share price quietly takes for granted. The number on the right is what the model actually assumes. When the two are far apart, that gap is the bet you would be taking.
Ten years, in charts
Revenue and earnings per share in ₹, return on equity and leverage as ratios — all from the filed statements.
The numbers behind them
Revenue and net profit as filed, in ₹ crore.
| Year | Revenue | Net profit | Margin |
|---|---|---|---|
| FY2018 | 1,19,862 | 8,004 | 6.7% |
| FY2019 | 1,41,007 | 10,217 | 7.2% |
| FY2020 | 1,45,452 | 10,894 | 7.5% |
| FY2021 | 1,35,979 | 12,921 | 9.5% |
| FY2022 | 1,56,521 | 10,419 | 6.7% |
| FY2023 | 1,83,341 | 12,531 | 6.8% |
| FY2024 | 2,21,113 | 15,547 | 7.0% |
| FY2025 | 2,55,734 | 15,037 | 5.9% |
| FY2026 | 2,85,874 | 18,954 | 6.6% |
How this company gets valued — and why
This is a group of businesses with different economics. A single discounted cash flow across all of them averages them into something that describes none of them, so our engine withholds a single blended fair value rather than publishing a number it cannot defend. The parts are valued separately instead.
Estimate withheld — the engine says so itselfUnderstand this method
- Margin of Safety: The Idea That Protects Your Capital
- Overvalued vs Undervalued Stocks: How to Tell the Difference
- How to Calculate the Fair Value of a Share
- How every one of our infrastructure & engineering stocks is valued
The complete valuation
Unlock the complete valuation report
- ✓Fair value per share — with the full working behind it
- ✓Bull, base and bear cases — and what moves between them
- ✓Every assumption — growth, margins, cost of capital, with sources
- ✓Peer comparison — how rivals are priced on the same measures
- ✓Downloadable PDF report — the full write-up, yours to keep
Compare with peers
The same valuation, run side by side.
LARSEN & TOUBRO vs Siemens IndiaBoth industrial, one project-led and one product-led.→LARSEN & TOUBRO vs ABB IndiaAutomation and electrification against engineering and construction.→LARSEN & TOUBRO vs BHELThe public-sector heavy-engineering comparison.→LARSEN & TOUBRO vs Adani PortsBoth build and operate long-life infrastructure, funded on very different terms.→LARSEN & TOUBRO vs Reliance IndustriesTwo of the heaviest capital spenders in the index, judged on what that spending earns back.→LARSEN & TOUBRO vs Hindustan AeronauticsEngineering and construction against defence manufacturing — both won on order books.→Frequently asked
Is LARSEN & TOUBRO overvalued?
At ₹3,851 the market is pricing in roughly 3% sustained growth, against the ~16% its own record supports. That is less than it has delivered — on these numbers the market is asking the business for less than its own record, which usually means it doubts the record repeats.
What is the intrinsic value of LARSEN & TOUBRO?
This business is a group of operations with different economics, so a single blended figure would describe none of them. The parts are valued separately and the breakdown is in the report, rather than one number that cannot be defended.
Is LARSEN & TOUBRO a good long-term investment?
Revenue went from ₹1.20 lakh crore to ₹2.86 lakh crore over the period shown, while return on equity moved from 17.4% to 18.4%. Growing scale on a rising return is a very different proposition from growing scale on a falling one.
How much debt does LARSEN & TOUBRO carry?
Debt to equity stands at 0.58, down from 0.66 at the start of the period — the balance sheet is a core input to the cost of capital used here.
How does FairStocks calculate fair value?
From published financial statements. The method is chosen to fit the business — a bank on excess return, a regulated utility on its rate base, a conglomerate by its parts — and every assumption is shown with its source. When the numbers do not support an estimate, no estimate is published. This is an educational research tool: it reports what the model computed and does not recommend buying or selling anything.
What assumptions are used to value LARSEN & TOUBRO?
A cost of capital of 11.20%, growth drawn from the company's own record rather than from guidance, and the valuation method that fits the business. All of them are listed in the report, with how much each one moves the answer.