On this page ▾
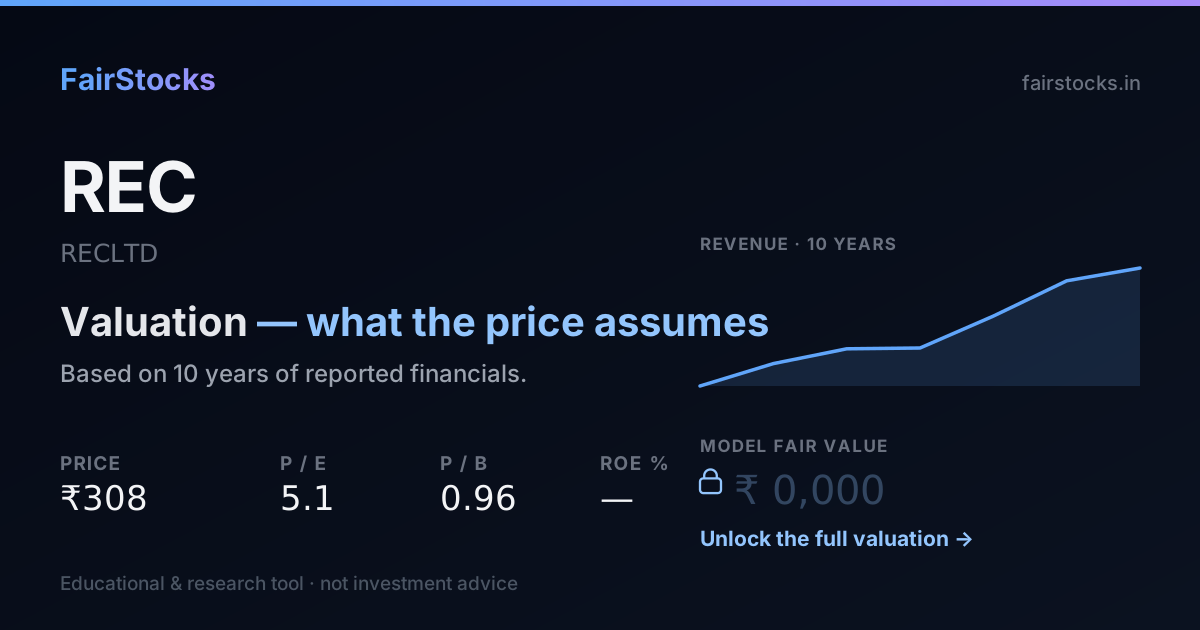
We do not publish one number for REC — and here is why.
On today's figures our model puts REC at roughly 6.7 times what the market pays for it. On a company this widely followed, a gap that large almost always means our model is missing something rather than that thousands of investors are wrong. So we show the workings and say plainly that we cannot stand behind a single figure here.
- How it is valued: no single figure is published here — our model and the market disagree too far.
- What the price assumes: 10.1% return on equity, against 19.7% the model takes from its own record.
- Ten-year record: Between FY2020 and FY2026, REC's revenue went from ₹29,930 crore to ₹59,584 crore — it compounded at about 12% a year over 6 years.
- Biggest swing factor: Loan growth. Main risk: Sector concentration.
01Rural electrification to infrastructure lending
REC Ltd, formerly Rural Electrification Corporation, was set up in 1969 to fund electricity in villages. It now lends across the power sector — generation, transmission, distribution and renewables — and increasingly to other infrastructure.
Power Finance Corporation bought the government's majority stake in REC in 2019, so REC is a subsidiary of PFC, which is itself majority-owned by the government.
02What the market is assuming
Work backwards from today's share price and you can see what buyers are quietly taking for granted. Here is the return on equity that price implies for REC, next to what the model assumes from the company's own record.
The further apart these two numbers are, the bigger the bet a buyer at today's price is making.
03REC's record, in plain numbers
Between FY2020 and FY2026, REC's revenue went from ₹29,930 crore to ₹59,584 crore — it compounded at about 12% a year over 6 years. Net profit grew from ₹4,972 crore to ₹16,308 crore, about 22% a year — faster than revenue, so margins widened. In FY2026 it kept 27.4% of revenue as net profit — against a low of 16.6% in FY2020 and a high of 29.8% in FY2024. The latest year added 5.7% to revenue, well behind its own long-run pace.
Revenue and earnings per share in ₹, return on equity and leverage as ratios — all from the filed statements.
Revenue and net profit by year (₹ crore)
| Year | Revenue | Net profit | Margin |
|---|---|---|---|
| FY2020 | 29,930 | 4,972 | 16.6% |
| FY2021 | 35,553 | 8,378 | 23.6% |
| FY2022 | 39,269 | 10,036 | 25.6% |
| FY2023 | 39,478 | 11,167 | 28.3% |
| FY2024 | 47,505 | 14,145 | 29.8% |
| FY2025 | 56,367 | 15,884 | 28.2% |
| FY2026 | 59,584 | 16,308 | 27.4% |
04How REC gets valued — and why
Estimate withheld — model and market disagree too farOur model and the market disagree so far apart on this company that the model is the more likely one to be wrong. Rather than publish a number we cannot stand behind, we show the workings and say so.
05What decides REC's value
Loan growth
Power and renewable investment drives demand.
Spreads
State backing keeps funding costs low.
Asset quality
Recoveries from stressed projects support profit.
Dividends
REC pays a large share of profit.
06What could go wrong
- Sector concentration. Heavy exposure to power utilities.
- State discom finances. Weak distributors can delay repayments.
- Policy. Government direction can shape lending.
07What the full REC valuation shows
Sign in free to see the complete REC valuation
- ✓The full model workings — and exactly where the model and the market part ways
- ✓Every assumption — growth, returns and cost of capital, with sources
- ✓Bull, base and bear cases — and exactly which assumptions move between them
- ✓Peer comparison — against PFC, IRFC and other lenders
- ✓Downloadable report — the full write-up, yours to keep
08Questions people ask about REC
Who owns REC?
Power Finance Corporation holds a majority stake, bought from the government in 2019.
What does REC lend for?
Power generation, transmission, distribution, renewables and other infrastructure.
What is the difference between REC and PFC?
Both are state-backed power lenders; PFC is REC's parent.
Is REC overvalued?
At ₹302 the market is pricing in roughly 10.1% sustained ROE, against the ~19.7% its own record supports. That is less than it has delivered — on these numbers the market is asking the business for less than its own record, which usually means it doubts the record repeats.
What is the intrinsic value of REC?
This business is a group of operations with different economics, so a single blended figure would describe none of them. The parts are valued separately and the breakdown is in the report, rather than one number that cannot be defended.
How much debt does REC carry?
Debt to equity stands at 2.37, against 2.16 at the start of the period — the balance sheet is a core input to the cost of capital used here.