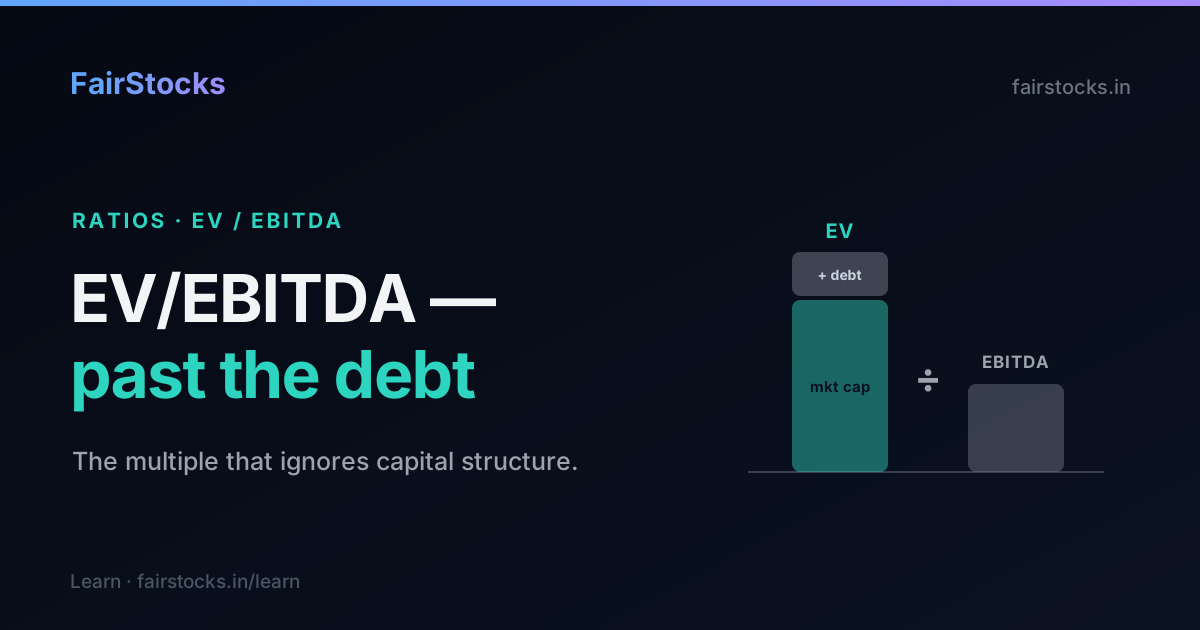
The P/E ratio has a blind spot: it judges a company partly on how it is financed rather than purely on the business underneath. EV/EBITDA was built to close that gap. It asks what the whole enterprise costs — equity and debt together — against the operating cash profit it throws off, so two companies can be compared on the merits of their operations alone. This guide explains what it measures, how to build it, when it is sharper than the P/E, and where it quietly misleads.
The problem EV/EBITDA solves
Imagine two companies that run identical operations — same factories, same products, same ₹100 crore of operating profit. The only difference is the balance sheet. Company A is debt-free. Company B borrowed heavily to build its plants and pays ₹40 crore a year in interest.
On the P/E ratio, Company B looks worse. Its net profit is dragged down by the interest bill, so the same operating business shows a lower, uglier bottom line. Yet the underlying operation is exactly as good. The P/E has been distorted by a financing decision, not a business fact.
EV/EBITDA removes that distortion. It measures the value of the entire business — the claims of shareholders and lenders — against profit measured before interest is paid. Financing drops out of both the top and the bottom of the ratio, so what is left is a clean comparison of the operating businesses themselves.
P/E asks: what are shareholders paying for the profit left over after the lenders are paid? EV/EBITDA asks: what is the whole business worth relative to the profit it generates before anyone is paid?
Building the two halves
Enterprise value (the "EV")
Enterprise value is what it would truly cost to buy the business outright. It starts with the market value of the equity and adjusts for the balance sheet:
\[\text{EV} = \text{Market Cap} + \text{Total Debt} - \text{Cash \& Equivalents}\]
The intuition is a takeover. To own the company you must:
- Buy every share — that is the market capitalisation.
- Repay its debt — you inherit the lenders' claim, so it adds to your cost.
- Keep its cash — the money already sitting on the balance sheet is yours once you own it, so it reduces the net price.
That is why a cash-rich company has an enterprise value below its market cap, and a debt-laden one has an EV above it. Market cap alone tells you the price of the equity; enterprise value tells you the price of the whole business.
EBITDA (the profit)
EBITDA is Earnings Before Interest, Tax, Depreciation and Amortisation. Start from operating profit and add back the two big non-cash charges:
\[\text{EBITDA} = \text{Operating Profit (EBIT)} + \text{Depreciation} + \text{Amortisation}\]
Stripping out interest and tax makes it financing- and jurisdiction-neutral; stripping out depreciation and amortisation makes it a rough proxy for the operating cash the business generates before reinvestment. That "rough" is doing real work — we will come back to it.
Put the two together and you have the multiple:
\[\text{EV/EBITDA} = \frac{\text{Market Cap} + \text{Debt} - \text{Cash}}{\text{EBITDA}}\]
A worked example
Take a mid-cap manufacturer. The market values its equity at ₹8,000 crore. It carries ₹3,000 crore of debt and holds ₹500 crore in cash. Last year it earned ₹1,200 crore of EBITDA.
First, enterprise value:
\[\text{EV} = 8{,}000 + 3{,}000 - 500 = 10{,}500 \text{ crore}\]
Then the multiple:
\[\text{EV/EBITDA} = \frac{10{,}500}{1{,}200} = 8.75\]
Now compare it with a debt-free peer whose equity is also worth ₹8,000 crore and which earns the same ₹1,200 crore of EBITDA, holding ₹500 crore of cash:
\[\text{EV} = 8{,}000 + 0 - 500 = 7{,}500 \text{ crore} \quad\Rightarrow\quad \text{EV/EBITDA} = \frac{7{,}500}{1{,}200} = 6.25\]
Identical equity price, identical operating profit — but the debt-free business is meaningfully cheaper on an enterprise basis, because a buyer is not also taking on ₹3,000 crore of borrowings. The P/E ratio, looking only at the equity, would have missed that entirely. This is the whole point of the multiple.
EV/EBITDA vs P/E — a side-by-side
| P/E ratio | EV/EBITDA | |
|---|---|---|
| Numerator | Share price (equity only) | Enterprise value (equity + net debt) |
| Denominator | Net profit (after interest & tax) | EBITDA (before interest, tax, D&A) |
| Affected by debt? | Yes — interest hits net profit | No — capital-structure neutral |
| Affected by tax quirks? | Yes | Largely no |
| Affected by depreciation policy? | Yes | No — D&A added back |
| Works for banks? | Partly (P/B is better) | No |
| Best for | Quick read on a stable, low-debt company | Comparing peers with different debt, or a takeover lens |
| Blind spot | Distorted by leverage and one-offs | Ignores the real cost of capital spending |
The two are complements, not rivals. A company that looks cheap on P/E but expensive on EV/EBITDA is usually carrying debt the equity number is hiding. A company cheap on EV/EBITDA but expensive on P/E may be over-taxed or over-depreciated relative to its cash generation. The disagreement between the two is itself a signal worth chasing down.
What counts as a "good" EV/EBITDA in India?
As with every multiple, there is no magic number — only a number relative to the sector, the growth rate and the durability of earnings. As a rough frame of reference:
| Sector | Typical EV/EBITDA | Why |
|---|---|---|
| FMCG / consumer staples | 25 – 40 | Predictable, high-return, asset-light |
| IT services | 15 – 25 | Steady growth, negligible debt |
| Autos & auto ancillaries | 9 – 16 | Cyclical demand, strong franchises |
| Cement | 9 – 15 | Capital-heavy, cyclical pricing |
| Metals & mining | 4 – 8 | Deeply cyclical commodities |
| Telecom | 7 – 11 | Capital-heavy; EV/EBIT tells more |
| Pharma | 13 – 22 | Mixed domestic vs regulated-market exposure |
Illustrative ranges, not live figures — they shift with the cycle. Use them to understand why a multiple is high or low, never as a target to trade against.
A single-digit EV/EBITDA on a metals or cement name is often not a bargain at all — it is the market pricing in the downside of a cycle that is near its peak, exactly the trap described in the overvalued-vs-undervalued guide. The multiple is lowest when trailing profits are highest and about to fall.
Where EV/EBITDA quietly misleads
For all its elegance, the ratio has three real weaknesses. Charlie Munger famously suggested replacing "EBITDA" with "bullshit earnings," and the reasons are worth taking seriously.
1. It treats capital spending as free. By adding depreciation back, EBITDA pretends the plant never wears out. But for a cement, steel, telecom or power company, that plant genuinely does wear out and must be rebuilt with real cash. A business can post handsome EBITDA for years while every rupee of it — and more — disappears into keeping the assets running. For anything capital-heavy, cross-check against EV/EBIT (which keeps depreciation as a cost) and, better still, against free cash flow, which counts the capital spending that EBITDA ignores.
2. It ignores the cost of debt it so carefully includes. EV correctly adds debt to the price, but EBITDA sits above the interest line, so the ratio never charges the company for servicing that debt. Two firms with the same EV/EBITDA can have very different survival odds if one pays 6% on its borrowings and the other 12%. Read the multiple alongside the balance sheet — the debt and balance-sheet guide shows how.
3. It is useless for financial companies. For a bank, insurer or NBFC, borrowing is the raw material of the business, not a financing choice, so separating "operating profit" from "interest" is meaningless. Value those on price-to-book and return on equity instead.
EBITDA is a proxy for cash generation, not cash generation itself. The gap between the two is exactly the capital a business must spend to survive — and for asset-heavy companies that gap can swallow the whole number.
How to actually use EV/EBITDA
- Build the EV properly. Market cap plus debt minus cash — never use the share price alone. The whole advantage of the multiple lives in that adjustment.
- Use it to compare peers with different debt. This is where it shines: two companies in the same industry, one levered, one not.
- Cross-check with EV/EBIT for capital-heavy businesses. If the two diverge sharply, depreciation is large and real — trust the EBIT version.
- Never stop at EBITDA. Follow the profit down to free cash flow to see how much of it the owners actually keep.
- Judge it in context. Against the company's own five-year history and its closest listed peers, not against the market.
EV/EBITDA is one of the sharpest tools for comparing businesses on operating merit — but like the P/E, it is a question, not an answer. It tells you what the market is paying for a rupee of operating profit; it cannot tell you whether that profit is durable or whether it survives the journey to cash. That is what a full valuation is for. FairStocks builds enterprise value, EV/EBITDA, EV/EBIT and a complete DCF for any listed Indian company straight from its filed accounts — every assumption printed next to the number it produced.