On this page ▾
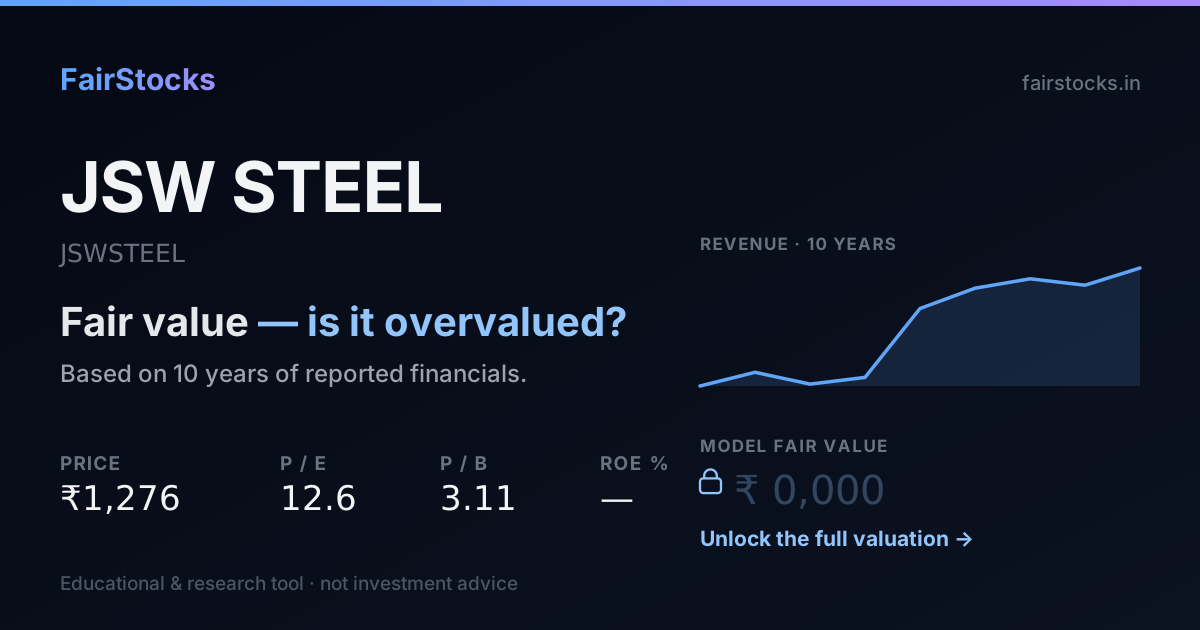
The market expects JSW Steel to do better than it ever has.
At today’s share price, buyers are assuming JSW Steel grows about 16% a year, forever. Over the last ten years it actually grew about 9% a year. So the share price only makes sense if the business improves on its own track record. If it simply carries on as before, buyers today have paid for something they will not get.
- How it is valued: Discounted cash flow.
- What the price assumes: 16% growth, against 9% the model takes from its own record.
- Ten-year record: Between FY2018 and FY2026, JSW Steel's revenue went from ₹71,503 crore to ₹1,85,470 crore — it compounded at about 13% a year over 8 years.
- Biggest swing factor: Steel spreads. Main risk: A downturn in steel prices.
01One of India's two largest steelmakers
JSW Steel, the flagship of Sajjan Jindal's JSW group, is one of India's two largest steel producers. Its biggest plant is at Vijayanagar in Karnataka, with others at Dolvi in Maharashtra and in Odisha, Tamil Nadu and Chhattisgarh, and it bought Bhushan Power & Steel out of insolvency in 2021.
It makes flat and long steel for cars, appliances, construction and infrastructure, and sells a growing share as higher-value coated and specialty products. Its profit depends on the spread between steel prices and the cost of iron ore and coking coal.
02What the market is assuming
Work backwards from today's share price and you can see what buyers are quietly taking for granted. Here is the growth that price implies for JSW Steel, next to what the model assumes from the company's own record.
The further apart these two numbers are, the bigger the bet a buyer at today's price is making.
03JSW Steel's record, in plain numbers
Between FY2018 and FY2026, JSW Steel's revenue went from ₹71,503 crore to ₹1,85,470 crore — it compounded at about 13% a year over 8 years. Net profit grew from ₹6,113 crore to ₹25,508 crore, about 20% a year — faster than revenue, so margins widened. In FY2026 it kept 13.8% of revenue as net profit — against a low of 2.1% in FY2025 and a high of 14.3% in FY2022. The latest year added 9.9% to revenue, close to its own long-run pace.
Revenue and earnings per share in ₹, return on equity and leverage as ratios — all from the filed statements.
Revenue and net profit by year (₹ crore)
| Year | Revenue | Net profit | Margin |
|---|---|---|---|
| FY2018 | 71,503 | 6,113 | 8.5% |
| FY2019 | 84,757 | 7,524 | 8.9% |
| FY2020 | 73,326 | 3,919 | 5.3% |
| FY2021 | 79,839 | 7,873 | 9.9% |
| FY2022 | 1,46,371 | 20,938 | 14.3% |
| FY2023 | 1,65,960 | 4,139 | 2.5% |
| FY2024 | 1,75,006 | 8,973 | 5.1% |
| FY2025 | 1,68,824 | 3,491 | 2.1% |
| FY2026 | 1,85,470 | 25,508 | 13.8% |
04How JSW Steel gets valued — and why
Discounted cash flowThis business is valued on the cash it is expected to generate, discounted back at its cost of capital — with growth taken from its own ten-year record rather than from guidance.
05What decides JSW Steel's value
Steel spreads
The gap between steel prices and raw-material costs drives profit far more than volumes do.
Capacity expansion
JSW keeps adding capacity; returns on that capex decide long-term value.
Debt
Expansion is partly debt-funded, so interest costs and balance-sheet strength matter.
Import competition
Cheap imports, especially from China, can cap Indian steel prices; safeguard duties help.
06What could go wrong
- A downturn in steel prices. Steel profits can fall by half or more in a weak year.
- Coking coal costs. Most coking coal is imported and its price is volatile.
- Leverage. High debt magnifies the impact of a weak cycle.
07What the full JSW Steel valuation shows
Sign in free to see the complete JSW Steel valuation
- ✓Fair value per share — from a ten-year discounted cash flow, every step shown
- ✓The Workbench — change revenue growth, the discount rate or terminal growth and watch JSW Steel's value move
- ✓Bull, base and bear cases — and exactly which assumptions move between them
- ✓Peer comparison — against Tata Steel, UltraTech Cement and Larsen & Toubro
- ✓Downloadable report — the full write-up, yours to keep
08Compare JSW Steel with peers
The same valuation, run side by side.
JSW Steel vs UltraTech CementSteel and cement — the same construction demand, different cost curves.→JSW Steel vs Tata SteelThe closest steel comparison, on a different debt profile.→JSW Steel vs Larsen & ToubroThe customer for much of what it makes.→09Questions people ask about JSW Steel
Why are JSW Steel's profits so volatile?
Because steel is a commodity: prices and raw-material costs swing much more than volumes, so profit can rise or fall sharply from one year to the next.
How does a DCF handle a cyclical company?
By working from cash flows across the cycle rather than one good or bad year — which is why ten years of history matter here.
JSW Steel or Tata Steel — which is better value?
Both are valued on the same cash-flow model; the comparison page sets them side by side.
Is JSW Steel overvalued?
At ₹1,348 the market is pricing in roughly 16% sustained growth, against the ~9% its own record supports. That is more than it has delivered, so the price is justified only if the business can hold a rate it has not previously sustained.
What is the intrinsic value of JSW Steel?
It is computed from the filed financial statements using the method that fits this business (discounted cash flow), with every assumption shown alongside the result. The per-share figure and the full working are in the report.
How much debt does JSW Steel carry?
Debt to equity stands at 0.76, down from 0.94 at the start of the period — the balance sheet is a core input to the cost of capital used here.