On this page ▾
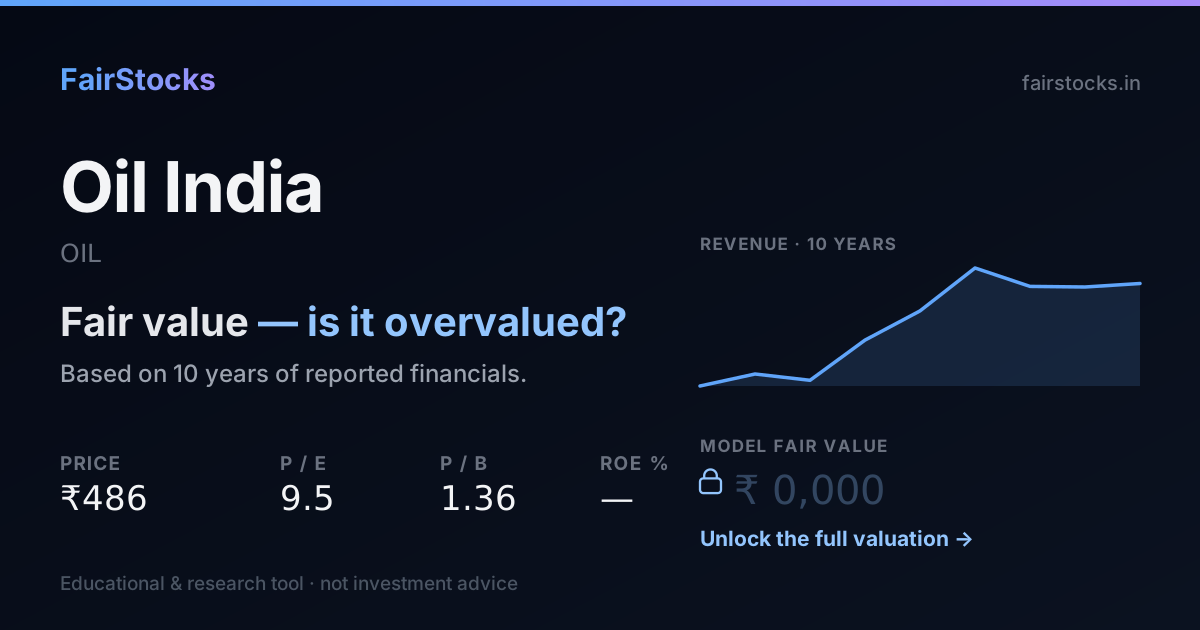
The market expects Oil India to carry on much as it has.
At today’s share price, buyers are assuming Oil India grows about 0% a year, forever. Over the last ten years it actually grew about 2% a year. The two are close, so the share price does not need the business to improve or to stumble. It needs it to keep doing roughly what it already does.
- How it is valued: Discounted cash flow.
- What the price assumes: 0% growth, against 2% the model takes from its own record.
- Ten-year record: Between FY2018 and FY2026, Oil India's revenue went from ₹10,698 crore to ₹37,050 crore — it compounded at about 17% a year over 8 years.
- Biggest swing factor: Crude prices. Main risk: Oil price falls.
01India's second state oil producer
Oil India, majority-owned by the Government of India and headquartered at Duliajan in Assam, explores for and produces crude oil and natural gas, mainly in the north-east, with interests abroad.
Since 2021 it has owned the majority of Numaligarh Refinery, which is tripling its capacity. That refinery is why Oil India's consolidated revenue jumped.
02What the market is assuming
Work backwards from today's share price and you can see what buyers are quietly taking for granted. Here is the growth that price implies for Oil India, next to what the model assumes from the company's own record.
The further apart these two numbers are, the bigger the bet a buyer at today's price is making.
03Oil India's record, in plain numbers
Between FY2018 and FY2026, Oil India's revenue went from ₹10,698 crore to ₹37,050 crore — it compounded at about 17% a year over 8 years. Net profit grew from ₹2,735 crore to ₹7,551 crore, about 14% a year — slower than revenue, so margins narrowed. In FY2026 it kept 20.4% of revenue as net profit — against a low of 18.4% in FY2021 and a high of 31.4% in FY2020. The latest year added 2.4% to revenue, well behind its own long-run pace.
Revenue and earnings per share in ₹, return on equity and leverage as ratios — all from the filed statements.
Revenue and net profit by year (₹ crore)
| Year | Revenue | Net profit | Margin |
|---|---|---|---|
| FY2018 | 10,698 | 2,735 | 25.6% |
| FY2019 | 13,780 | 3,238 | 23.5% |
| FY2020 | 12,167 | 3,816 | 31.4% |
| FY2021 | 22,498 | 4,146 | 18.4% |
| FY2022 | 30,011 | 6,719 | 22.4% |
| FY2023 | 41,039 | 9,854 | 24.0% |
| FY2024 | 36,304 | 6,980 | 19.2% |
| FY2025 | 36,164 | 7,040 | 19.5% |
| FY2026 | 37,050 | 7,551 | 20.4% |
04How Oil India gets valued — and why
Discounted cash flowThis business is valued on the cash it is expected to generate, discounted back at its cost of capital — with growth taken from its own ten-year record rather than from guidance.
05What decides Oil India's value
Crude prices
Realisations drive upstream profit.
Production growth
New wells and gas projects in the north-east.
Numaligarh expansion
Tripling refinery capacity adds earnings.
Gas pricing
Government formulas set gas prices.
06What could go wrong
- Oil price falls. Lower prices cut profit.
- Windfall taxes. Levies have capped upside before.
- Project execution. The refinery expansion is large.
07What the full Oil India valuation shows
Sign in free to see the complete Oil India valuation
- ✓Fair value per share — from a ten-year discounted cash flow, every step shown
- ✓The Workbench — change revenue growth, the discount rate or terminal growth and watch Oil India's value move
- ✓Bull, base and bear cases — and exactly which assumptions move between them
- ✓Peer comparison — against ONGC, Indian Oil and GAIL
- ✓Downloadable report — the full write-up, yours to keep
08Questions people ask about Oil India
Where does Oil India produce oil?
Mainly in Assam and the north-east.
What is Oil India's link to Numaligarh Refinery?
It has owned the majority since 2021.
Oil India or ONGC — what is the difference?
Both are state oil producers; ONGC is much larger and owns HPCL.
Is Oil India overvalued?
At ₹442 the market is pricing in roughly 0% sustained growth, against the ~2% its own record supports. That is less than it has delivered — on these numbers the market is asking the business for less than its own record, which usually means it doubts the record repeats.
What is the intrinsic value of Oil India?
It is computed from the filed financial statements using the method that fits this business (discounted cash flow), with every assumption shown alongside the result. The per-share figure and the full working are in the report.
How much debt does Oil India carry?
Debt to equity stands at 0.78, against 0.58 at the start of the period — the balance sheet is a core input to the cost of capital used here.