On this page ▾
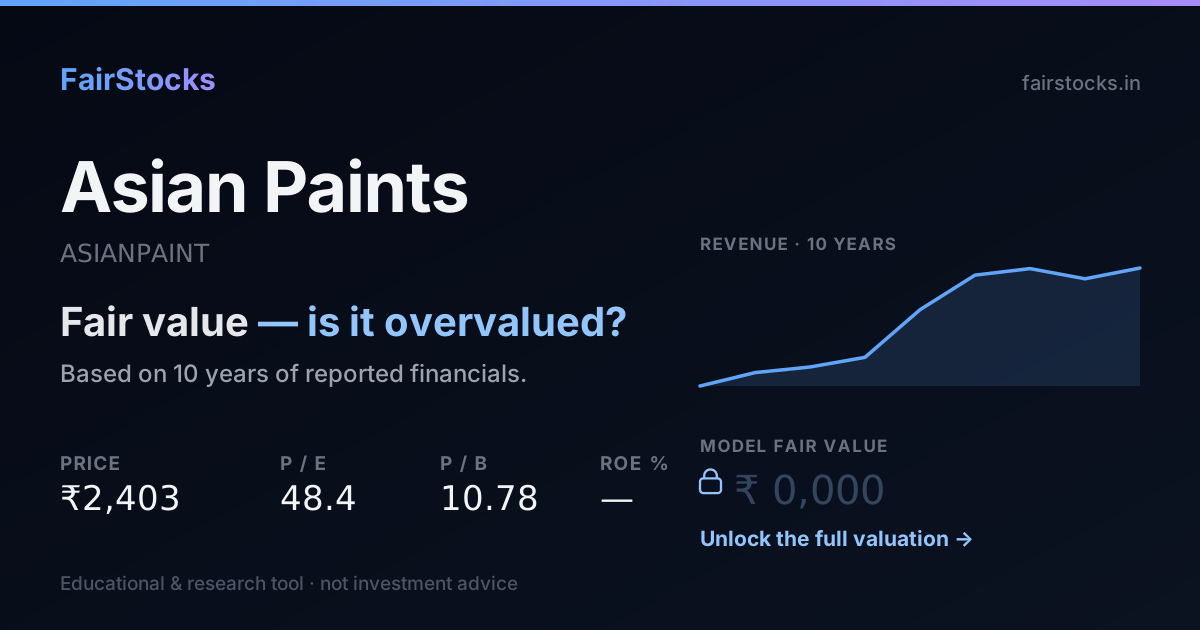
We do not publish one number for Asian Paints — and here is why.
On today's figures the market pays roughly 2.6 times what our model says Asian Paints is worth. On a company this widely followed, a gap that large almost always means our model is missing something rather than that thousands of investors are wrong. So we show the workings and say plainly that we cannot stand behind a single figure here.
- How it is valued: no single figure is published here — our model and the market disagree too far.
- What the price assumes: 25% growth, against 4% the model takes from its own record.
- Ten-year record: Between FY2018 and FY2026, Asian Paints' revenue went from ₹17,262 crore to ₹35,584 crore — it compounded at about 9% a year over 8 years.
- Biggest swing factor: Volume growth. Main risk: Price competition.
01India's paint leader, under attack
Asian Paints, founded in 1942, is India's largest paint company and has led the decorative-paints market for decades. Its strength is distribution: a network of dealers across the country and a supply chain that can restock them quickly.
It also sells waterproofing, adhesives and home-décor products such as kitchens and bathroom fittings, and operates in several overseas markets. Since 2024 it has faced a new well-funded competitor, Grasim's Birla Opus, alongside JSW Paints and others.
02What the market is assuming
Work backwards from today's share price and you can see what buyers are quietly taking for granted. Here is the growth that price implies for Asian Paints, next to what the model assumes from the company's own record.
The further apart these two numbers are, the bigger the bet a buyer at today's price is making.
03Asian Paints' record, in plain numbers
Between FY2018 and FY2026, Asian Paints' revenue went from ₹17,262 crore to ₹35,584 crore — it compounded at about 9% a year over 8 years. Net profit grew from ₹2,098 crore to ₹4,395 crore, about 10% a year — roughly in step with revenue. In FY2026 it kept 12.4% of revenue as net profit — against a low of 10.9% in FY2025 and a high of 15.7% in FY2024. The latest year added 4.9% to revenue, well behind its own long-run pace. FY2022 is missing from the filed series used here, so that year is left out rather than estimated.
Revenue and earnings per share in ₹, return on equity and leverage as ratios — all from the filed statements.
Revenue and net profit by year (₹ crore)
| Year | Revenue | Net profit | Margin |
|---|---|---|---|
| FY2018 | 17,262 | 2,098 | 12.2% |
| FY2019 | 19,350 | 2,212 | 11.4% |
| FY2020 | 20,211 | 2,774 | 13.7% |
| FY2021 | 21,713 | 3,207 | 14.8% |
| FY2022 | 29,101 | 9,167 | 31.5% |
| FY2023 | 34,489 | 4,195 | 12.2% |
| FY2024 | 35,495 | 5,558 | 15.7% |
| FY2025 | 33,906 | 3,710 | 10.9% |
| FY2026 | 35,584 | 4,395 | 12.4% |
04How Asian Paints gets valued — and why
Estimate withheld — model and market disagree too farOur model and the market disagree so far apart on this company that the model is the more likely one to be wrong. Rather than publish a number we cannot stand behind, we show the workings and say so.
05What decides Asian Paints' value
Volume growth
Repainting cycles and new housing drive demand.
Market share
How much share new entrants take decides whether Asian Paints can keep its margins.
Raw materials
Crude-linked chemicals and titanium dioxide are big costs.
Home décor
Adjacent businesses add growth but at lower margins.
06What could go wrong
- Price competition. Rivals offering bigger dealer incentives could force price cuts.
- Slower housing demand. Weak urban demand slows repainting.
- The multiple. A premium valuation leaves little room for disappointment.
07What the full Asian Paints valuation shows
Sign in free to see the complete Asian Paints valuation
- ✓Fair value per share — from a ten-year discounted cash flow, every step shown
- ✓The Workbench — change revenue growth, the discount rate or terminal growth and watch Asian Paints' value move
- ✓Bull, base and bear cases — and exactly which assumptions move between them
- ✓Peer comparison — against Hindustan Unilever, Titan and UltraTech Cement
- ✓Downloadable report — the full write-up, yours to keep
08Compare Asian Paints with peers
The same valuation, run side by side.
Asian Paints vs Hindustan UnileverBoth consumer moats where distribution and pricing power set the value.→Asian Paints vs Titan CompanyTwo discretionary consumer brands on the same income cycle.→Asian Paints vs UltraTech CementBoth sell into the same home-building and renovation demand.→09Questions people ask about Asian Paints
Why is Asian Paints under pressure?
Slower demand and new competitors, especially Birla Opus, have squeezed growth and margins in a market Asian Paints has led for decades.
What makes Asian Paints' business strong?
Its brand and dealer network, and a supply chain that keeps those dealers stocked with little inventory.
Asian Paints or HUL — which is better value?
Two consumer moats, compared side by side on their own page.
Is Asian Paints overvalued?
At ₹2,550 the market is pricing in roughly 25% sustained growth, against the ~4% its own record supports. That is more than it has delivered, so the price is justified only if the business can hold a rate it has not previously sustained.
What is the intrinsic value of Asian Paints?
This business is a group of operations with different economics, so a single blended figure would describe none of them. The parts are valued separately and the breakdown is in the report, rather than one number that cannot be defended.
How much debt does Asian Paints carry?
Debt to equity stands at 0.01, against 0.00 at the start of the period — the balance sheet is a core input to the cost of capital used here.