On this page ▾
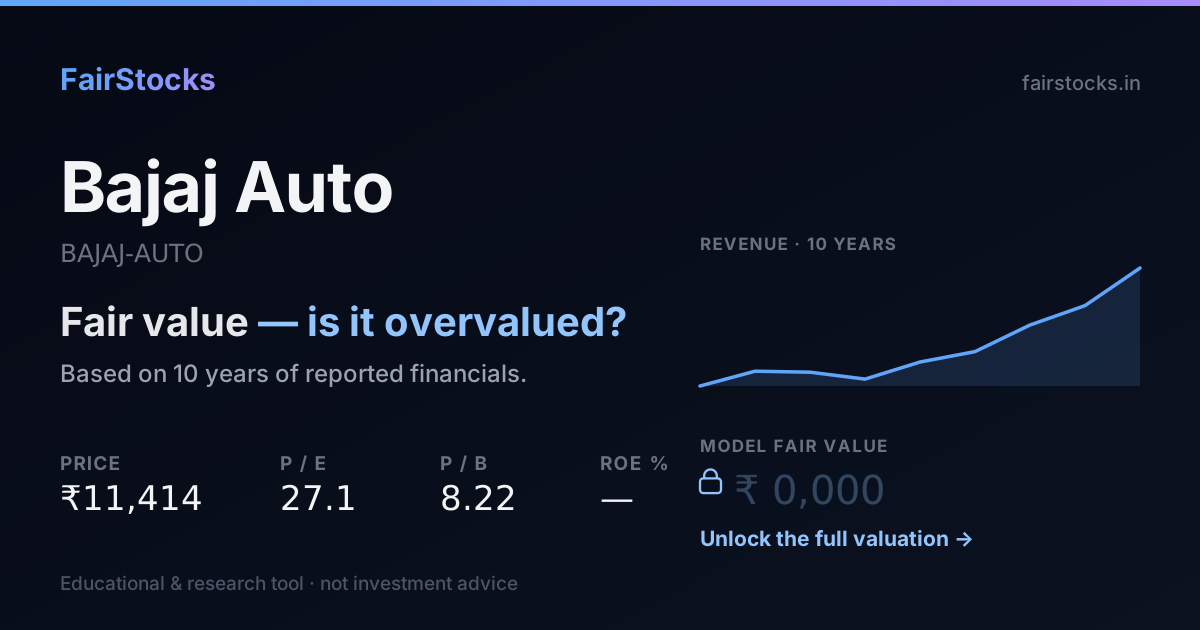
The market expects much less from Bajaj Auto than it has delivered before.
At today’s share price, buyers are assuming Bajaj Auto grows about 7% a year, forever. Over the last ten years it actually grew about 19% a year. That is a big step down from its own record. Either the market can see a problem that the published accounts do not show yet, or it is expecting a slowdown that has not happened.
- How it is valued: Discounted cash flow.
- What the price assumes: 7% growth, against 19% the model takes from its own record.
- Ten-year record: Between FY2018 and FY2026, Bajaj Auto's revenue went from ₹25,563 crore to ₹62,905 crore — it compounded at about 12% a year over 8 years.
- Biggest swing factor: Export demand. Main risk: Emerging-market currencies.
01Motorcycles, three-wheelers and exports
Bajaj Auto makes motorcycles such as the Pulsar, Platina and Dominar, the Chetak electric scooter and India's best-selling three-wheelers. It also builds and sells motorcycles in partnership with KTM and Triumph.
Exports are a large share of its sales, mostly to Africa, Latin America and South-East Asia, which makes it far more international than its domestic rivals. It carries little debt and a large investment portfolio.
02What the market is assuming
Work backwards from today's share price and you can see what buyers are quietly taking for granted. Here is the growth that price implies for Bajaj Auto, next to what the model assumes from the company's own record.
The further apart these two numbers are, the bigger the bet a buyer at today's price is making.
03Bajaj Auto's record, in plain numbers
Between FY2018 and FY2026, Bajaj Auto's revenue went from ₹25,563 crore to ₹62,905 crore — it compounded at about 12% a year over 8 years. Net profit grew from ₹4,219 crore to ₹10,574 crore, about 12% a year — roughly in step with revenue. In FY2026 it kept 16.8% of revenue as net profit — against a low of 14.4% in FY2025 and a high of 18.6% in FY2022. The latest year added 23.4% to revenue, well ahead of its own long-run pace.
Revenue and earnings per share in ₹, return on equity and leverage as ratios — all from the filed statements.
Revenue and net profit by year (₹ crore)
| Year | Revenue | Net profit | Margin |
|---|---|---|---|
| FY2018 | 25,563 | 4,219 | 16.5% |
| FY2019 | 30,250 | 4,928 | 16.3% |
| FY2020 | 29,919 | 5,212 | 17.4% |
| FY2021 | 27,741 | 4,857 | 17.5% |
| FY2022 | 33,145 | 6,166 | 18.6% |
| FY2023 | 36,455 | 6,060 | 16.6% |
| FY2024 | 44,870 | 7,708 | 17.2% |
| FY2025 | 50,995 | 7,325 | 14.4% |
| FY2026 | 62,905 | 10,574 | 16.8% |
04How Bajaj Auto gets valued — and why
Discounted cash flowThis business is valued on the cash it is expected to generate, discounted back at its cost of capital — with growth taken from its own ten-year record rather than from guidance.
05What decides Bajaj Auto's value
Export demand
Exports are a big share of volumes, and currencies in markets such as Nigeria can swing them sharply.
Premium motorcycles
Higher-priced models carry better margins than commuter bikes.
Electric two- and three-wheelers
Chetak and electric three-wheelers are growing fast; their profitability shapes the long-term picture.
Cash returns
Bajaj pays generous dividends from a large cash pile.
06What could go wrong
- Emerging-market currencies. Devaluations hit export volumes and margins.
- EV competition. Start-ups and incumbents are crowding the electric scooter market.
- Supply chains. Rare-earth magnet shortages from China disrupted electric-vehicle output in 2025.
07What the full Bajaj Auto valuation shows
Sign in free to see the complete Bajaj Auto valuation
- ✓Fair value per share — from a ten-year discounted cash flow, every step shown
- ✓The Workbench — change revenue growth, the discount rate or terminal growth and watch Bajaj Auto's value move
- ✓Bull, base and bear cases — and exactly which assumptions move between them
- ✓Peer comparison — against Eicher Motors, Maruti Suzuki and Mahindra & Mahindra
- ✓Downloadable report — the full write-up, yours to keep
08Compare Bajaj Auto with peers
The same valuation, run side by side.
Bajaj Auto vs Maruti SuzukiTwo-wheelers against passenger cars, on the same household income cycle.→Bajaj Auto vs Mahindra & MahindraMotorcycles and scooters against utility vehicles and tractors.→Bajaj Auto vs Eicher MotorsThe nearest premium two-wheeler comparison.→09Questions people ask about Bajaj Auto
How important are exports to Bajaj Auto?
Very. A large share of its volumes is sold abroad, so exchange rates and demand in Africa and Latin America matter as much as the Indian market.
Is Bajaj Auto an EV company?
Partly: the Chetak scooter and electric three-wheelers are growing quickly, but petrol motorcycles still earn most of its profit.
Bajaj Auto or Eicher Motors — which is better value?
Both are valued on the same cash-flow model; the comparison page sets them side by side.
Is Bajaj Auto overvalued?
At ₹10,850 the market is pricing in roughly 7% sustained growth, against the ~19% its own record supports. That is less than it has delivered — on these numbers the market is asking the business for less than its own record, which usually means it doubts the record repeats.
What is the intrinsic value of Bajaj Auto?
It is computed from the filed financial statements using the method that fits this business (discounted cash flow), with every assumption shown alongside the result. The per-share figure and the full working are in the report.
How much debt does Bajaj Auto carry?
Debt to equity stands at 0.40, against 0.00 at the start of the period — the balance sheet is a core input to the cost of capital used here.