On this page ▾
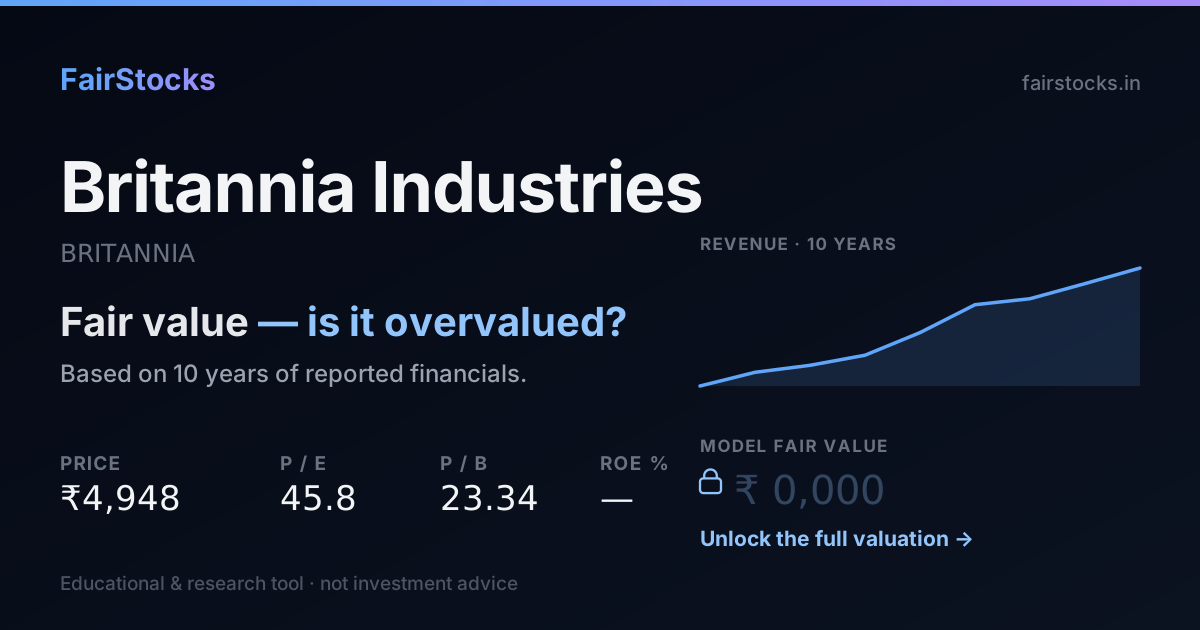
The market expects Britannia to carry on much as it has.
At today’s share price, buyers are assuming Britannia grows about 10% a year, forever. Over the last ten years it actually grew about 7% a year. The two are close, so the share price does not need the business to improve or to stumble. It needs it to keep doing roughly what it already does.
- How it is valued: Discounted cash flow.
- What the price assumes: 10% growth, against 7% the model takes from its own record.
- Ten-year record: Between FY2018 and FY2026, Britannia's revenue went from ₹9,990 crore to ₹19,152 crore — it compounded at about 8% a year over 8 years.
- Biggest swing factor: Volume growth. Main risk: Input inflation.
01India's biscuit maker
Britannia Industries, founded in Kolkata in 1892 and controlled by the Wadia group, is one of India's largest food companies. Good Day, Marie Gold, NutriChoice, Tiger, Bourbon and 50-50 make it a leader in biscuits.
It also sells bread, cakes, rusks and cheese — the cheese through a joint venture with France's Bel group — and has been building a stronger presence in rural India.
02What the market is assuming
Work backwards from today's share price and you can see what buyers are quietly taking for granted. Here is the growth that price implies for Britannia, next to what the model assumes from the company's own record.
The further apart these two numbers are, the bigger the bet a buyer at today's price is making.
03Britannia's record, in plain numbers
Between FY2018 and FY2026, Britannia's revenue went from ₹9,990 crore to ₹19,152 crore — it compounded at about 8% a year over 8 years. Net profit grew from ₹1,004 crore to ₹2,537 crore, about 12% a year — faster than revenue, so margins widened. In FY2026 it kept 13.2% of revenue as net profit — against a low of 10.0% in FY2018 and a high of 14.2% in FY2021. The latest year added 6.7% to revenue, close to its own long-run pace.
Revenue and earnings per share in ₹, return on equity and leverage as ratios — all from the filed statements.
Revenue and net profit by year (₹ crore)
| Year | Revenue | Net profit | Margin |
|---|---|---|---|
| FY2018 | 9,990 | 1,004 | 10.0% |
| FY2019 | 11,055 | 1,155 | 10.5% |
| FY2020 | 11,600 | 1,394 | 12.0% |
| FY2021 | 12,379 | 1,760 | 14.2% |
| FY2022 | 14,136 | 1,516 | 10.7% |
| FY2023 | 16,301 | 2,316 | 14.2% |
| FY2024 | 16,769 | 2,134 | 12.7% |
| FY2025 | 17,943 | 2,178 | 12.1% |
| FY2026 | 19,152 | 2,537 | 13.2% |
04How Britannia gets valued — and why
Discounted cash flowThis business is valued on the cash it is expected to generate, discounted back at its cost of capital — with growth taken from its own ten-year record rather than from guidance.
05What decides Britannia's value
Volume growth
Rural reach and premium biscuits drive sales.
Commodity costs
Wheat, sugar, milk and palm oil feed straight into margins.
Adjacent categories
Cakes, croissants and dairy add growth.
Distribution
Direct reach into villages expands the market.
06What could go wrong
- Input inflation. Sudden cost increases squeeze margins.
- Competition. Parle, ITC and regional players fight for shelf space.
- Slower demand. Weak consumer spending hurts volumes.
07What the full Britannia valuation shows
Sign in free to see the complete Britannia valuation
- ✓Fair value per share — from a ten-year discounted cash flow, every step shown
- ✓The Workbench — change revenue growth, the discount rate or terminal growth and watch Britannia's value move
- ✓Bull, base and bear cases — and exactly which assumptions move between them
- ✓Peer comparison — against Nestle India, Hindustan Unilever and ITC
- ✓Downloadable report — the full write-up, yours to keep
08Compare Britannia with peers
The same valuation, run side by side.
Britannia vs Nestle IndiaTwo packaged-foods majors on very different payout policies.→Britannia vs Hindustan UnileverBiscuits and dairy against the broader FMCG book.→Britannia vs ITCPackaged foods against a diversified staples-and-cigarettes giant.→09Questions people ask about Britannia
What are Britannia's biggest brands?
Good Day, Marie Gold, NutriChoice, Tiger and 50-50 biscuits.
How do commodity prices affect Britannia?
Wheat, sugar and palm oil are major costs; price increases follow with a lag.
Britannia or Nestle India — which is better value?
Two packaged-food majors, compared side by side on their own page.
Is Britannia overvalued?
At ₹4,750 the market is pricing in roughly 10% sustained growth, against the ~7% its own record supports. That is more than it has delivered, so the price is justified only if the business can hold a rate it has not previously sustained.
What is the intrinsic value of Britannia?
It is computed from the filed financial statements using the method that fits this business (discounted cash flow), with every assumption shown alongside the result. The per-share figure and the full working are in the report.
How much debt does Britannia carry?
Debt to equity stands at 0.06, down from 0.44 at the start of the period — the balance sheet is a core input to the cost of capital used here.