On this page ▾
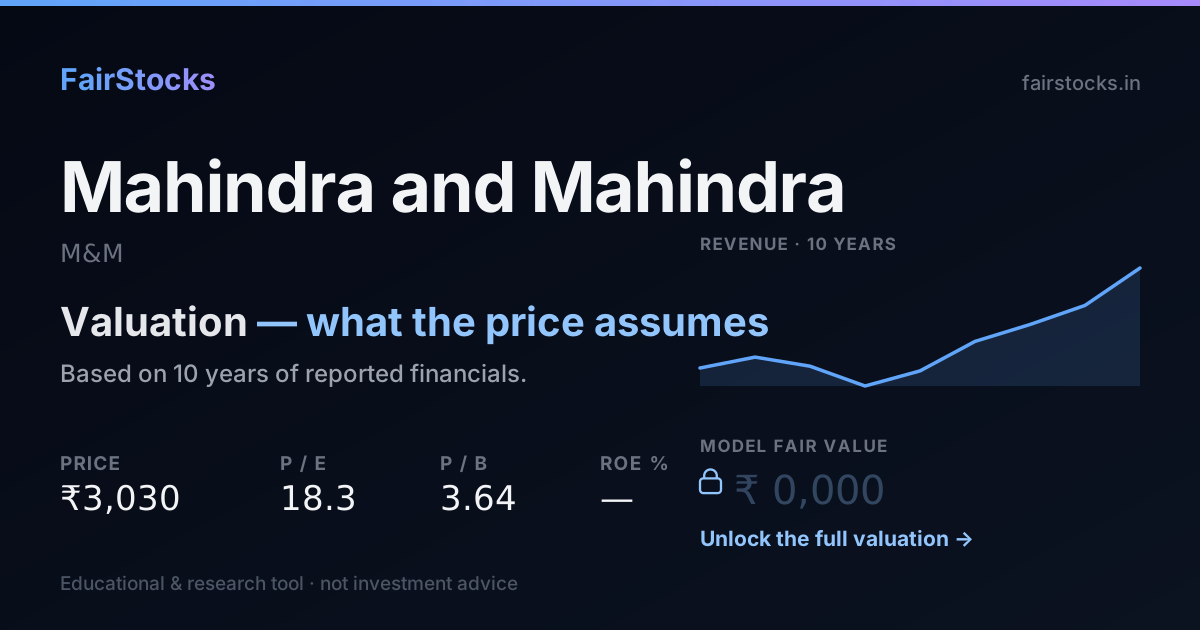
We do not publish one number for Mahindra & Mahindra — and here is why.
On today's figures our model puts Mahindra & Mahindra at roughly 4.3 times what the market pays for it. On a company this widely followed, a gap that large almost always means our model is missing something rather than that thousands of investors are wrong. So we show the workings and say plainly that we cannot stand behind a single figure here.
- How it is valued: no single figure is published here — our model and the market disagree too far.
- What the price assumes: 0% growth, against 20% the model takes from its own record.
- Ten-year record: Between FY2018 and FY2026, Mahindra & Mahindra's revenue went from ₹93,265 crore to ₹1,98,639 crore — it compounded at about 10% a year over 8 years.
- Biggest swing factor: SUV volumes and margins. Main risk: A weak monsoon.
01Tractors, SUVs and a group around them
Mahindra & Mahindra is India's largest tractor maker by volume and a leading maker of SUVs and light commercial vehicles — the Thar, Scorpio-N, XUV700 and XUV 3XO, and electric SUVs under the BE and XEV names. Its farm business also sells tractors abroad.
Around the auto and farm core sits a group: Mahindra Finance lends to rural customers, Mahindra Lifespaces develops property, Club Mahindra runs holiday resorts, and M&M holds a large stake in Tech Mahindra. The consolidated accounts mix all of these together.
02What the market is assuming
Work backwards from today's share price and you can see what buyers are quietly taking for granted. Here is the growth that price implies for Mahindra & Mahindra, next to what the model assumes from the company's own record.
The further apart these two numbers are, the bigger the bet a buyer at today's price is making.
03Mahindra & Mahindra's record, in plain numbers
Between FY2018 and FY2026, Mahindra & Mahindra's revenue went from ₹93,265 crore to ₹1,98,639 crore — it compounded at about 10% a year over 8 years. It reported a net loss in FY2020, and closed the period with net profit of ₹18,622 crore. In FY2026 it kept 9.4% of revenue as net profit — its best year in the period. The latest year added 24.8% to revenue, well ahead of its own long-run pace.
Revenue and earnings per share in ₹, return on equity and leverage as ratios — all from the filed statements.
Revenue and net profit by year (₹ crore)
| Year | Revenue | Net profit | Margin |
|---|---|---|---|
| FY2018 | 93,265 | 7,958 | 8.5% |
| FY2019 | 1,04,721 | 6,017 | 5.7% |
| FY2020 | 95,179 | -321 | -0.3% |
| FY2021 | 74,278 | 1,512 | 2.0% |
| FY2022 | 90,171 | 7,253 | 8.0% |
| FY2023 | 1,21,269 | 11,374 | 9.4% |
| FY2024 | 1,39,078 | 12,270 | 8.8% |
| FY2025 | 1,59,211 | 14,073 | 8.8% |
| FY2026 | 1,98,639 | 18,622 | 9.4% |
04How Mahindra & Mahindra gets valued — and why
Estimate withheld — model and market disagree too farOur model and the market disagree so far apart on this company that the model is the more likely one to be wrong. Rather than publish a number we cannot stand behind, we show the workings and say so.
05What decides Mahindra & Mahindra's value
SUV volumes and margins
SUVs are where most of the recent profit growth has come from; holding waiting lists and pricing matters more than volume alone.
The tractor cycle
Tractor demand follows the monsoon, crop prices and rural credit, so farm profits swing year to year.
Capital allocation
Management has committed to exiting businesses that don't earn their cost of capital; delivering on that changes what the group is worth.
EV investment
Electric SUVs need heavy investment before they earn; the return on it shapes long-term value.
06What could go wrong
- A weak monsoon. Poor rains hit tractor sales and rural lending at the same time.
- SUV competition. Every major carmaker is now targeting the segment Mahindra leads.
- Losses in smaller businesses. Group companies outside auto and farm have a history of write-downs.
07What the full Mahindra & Mahindra valuation shows
Sign in free to see the complete Mahindra & Mahindra valuation
- ✓The full model workings — and exactly where the model and the market part ways
- ✓Every assumption — growth, margins and cost of capital, with sources
- ✓Bull, base and bear cases — and exactly which assumptions move between them
- ✓Peer comparison — against Maruti Suzuki, Tata Motors, Bajaj Auto and L&T
- ✓Downloadable report — the full write-up, yours to keep
08Compare Mahindra & Mahindra with peers
The same valuation, run side by side.
Mahindra & Mahindra vs Maruti SuzukiUtility vehicles and tractors against passenger cars.→Mahindra & Mahindra vs Tata MotorsBoth make commercial vehicles; since its 2025 demerger Tata Motors is purely trucks and buses.→Mahindra & Mahindra vs Larsen & ToubroTractors and utility vehicles against engineering — both geared to the rural and capex cycle.→Mahindra & Mahindra vs Bajaj AutoUtility vehicles and tractors against motorcycles and scooters.→Mahindra & Mahindra vs Escorts KubotaTractors head to head, without the auto business.09Questions people ask about Mahindra & Mahindra
Why is M&M hard to value with one model?
Its consolidated accounts combine a carmaker, a tractor business, a rural lender and stakes in IT, property and hospitality. A single growth rate and cost of capital across all of them fits none of them well.
Is M&M a tractor company or an SUV company?
Both. Tractors made Mahindra and still lead the Indian market, but SUVs have become the bigger profit engine in recent years.
How does the monsoon affect M&M?
A good monsoon lifts farm incomes, tractor sales and repayments at Mahindra Finance; a poor one hits all three together.
Is Mahindra & Mahindra overvalued?
At ₹3,333 the market is pricing in roughly 0% sustained growth, against the ~20% its own record supports. That is less than it has delivered — on these numbers the market is asking the business for less than its own record, which usually means it doubts the record repeats.
What is the intrinsic value of Mahindra & Mahindra?
This business is a group of operations with different economics, so a single blended figure would describe none of them. The parts are valued separately and the breakdown is in the report, rather than one number that cannot be defended.