On this page ▾
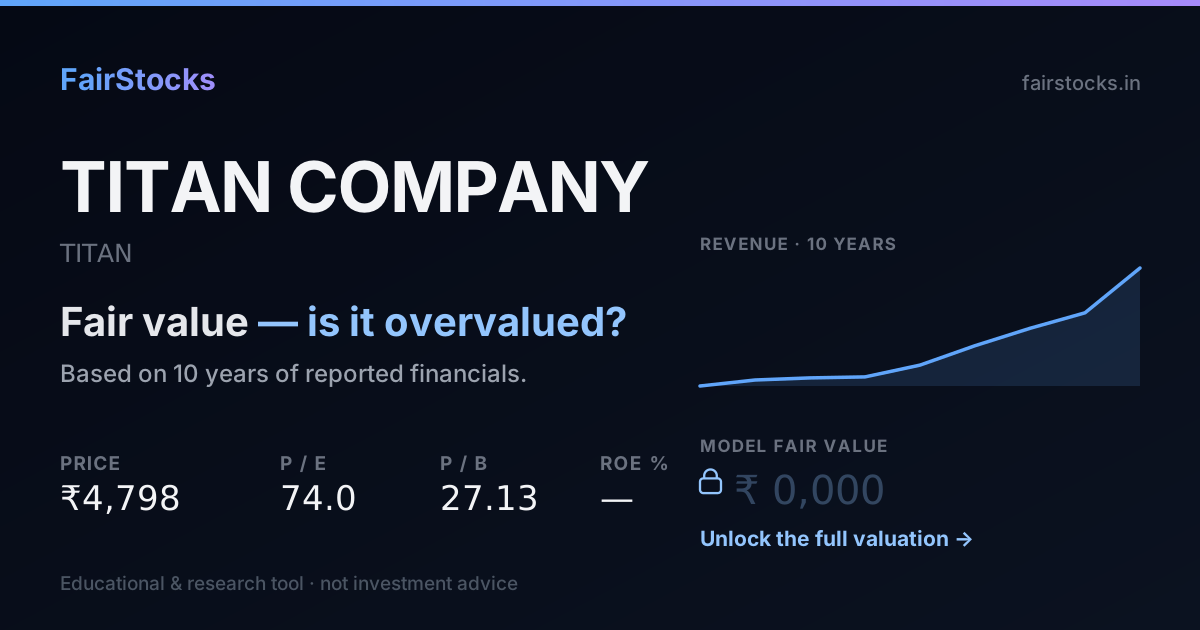
The market expects Titan Company to carry on much as it has.
At today’s share price, buyers are assuming Titan Company grows about 34% a year, forever. Over the last ten years it actually grew about 32% a year. The two are close, so the share price does not need the business to improve or to stumble. It needs it to keep doing roughly what it already does.
- How it is valued: Discounted cash flow.
- What the price assumes: 34% growth, against 32% the model takes from its own record.
- Ten-year record: Between FY2018 and FY2026, Titan Company's revenue went from ₹16,156 crore to ₹87,584 crore — it compounded at about 24% a year over 8 years.
- Biggest swing factor: Share gains from local jewellers. Main risk: The multiple.
01A watchmaker that became a jeweller
Titan Company, a Tata group company promoted jointly with the Tamil Nadu government's TIDCO, began making watches in the 1980s and now earns most of its revenue from jewellery through Tanishq, Mia, Zoya and CaratLane. It also sells watches (Titan, Fastrack, Sonata), eyewear (Titan Eye+), fragrances and Taneira saris.
Jewellery revenue rises and falls with the gold price, because customers pay for the metal as well as the making charges. Revenue can jump in a year of rising gold prices even when the number of pieces sold barely moves.
02What the market is assuming
Work backwards from today's share price and you can see what buyers are quietly taking for granted. Here is the growth that price implies for Titan Company, next to what the model assumes from the company's own record.
The further apart these two numbers are, the bigger the bet a buyer at today's price is making.
03Titan Company's record, in plain numbers
Between FY2018 and FY2026, Titan Company's revenue went from ₹16,156 crore to ₹87,584 crore — it compounded at about 24% a year over 8 years. Net profit grew from ₹1,102 crore to ₹5,073 crore, about 21% a year — slower than revenue, so margins narrowed. In FY2026 it kept 5.8% of revenue as net profit — against a low of 4.5% in FY2021 and a high of 8.1% in FY2023. The latest year added 44.9% to revenue, well ahead of its own long-run pace.
Revenue and earnings per share in ₹, return on equity and leverage as ratios — all from the filed statements.
Revenue and net profit by year (₹ crore)
| Year | Revenue | Net profit | Margin |
|---|---|---|---|
| FY2018 | 16,156 | 1,102 | 6.8% |
| FY2019 | 19,779 | 1,389 | 7.0% |
| FY2020 | 21,052 | 1,493 | 7.1% |
| FY2021 | 21,644 | 979 | 4.5% |
| FY2022 | 28,799 | 2,197 | 7.6% |
| FY2023 | 40,575 | 3,274 | 8.1% |
| FY2024 | 51,084 | 3,496 | 6.8% |
| FY2025 | 60,456 | 3,337 | 5.5% |
| FY2026 | 87,584 | 5,073 | 5.8% |
04How Titan Company gets valued — and why
Discounted cash flowThis business is valued on the cash it is expected to generate, discounted back at its cost of capital — with growth taken from its own ten-year record rather than from guidance.
05What decides Titan Company's value
Share gains from local jewellers
Tanishq's growth has come from customers switching from family jewellers to trusted, hallmarked chains.
Studded jewellery
Diamond and studded pieces earn much higher margins than plain gold, so the mix matters as much as volume.
Gold prices
High gold prices lift revenue but can slow demand and squeeze margins on gold bought earlier.
Store expansion
New stores in smaller cities extend the runway, but each has to earn its keep.
06What could go wrong
- The multiple. A premium P/E leaves little room for a slower year.
- Gold volatility and duties. Sudden price swings or changes in import duty disrupt demand and margins.
- Organised competition. Other national and regional chains are expanding into the same markets.
07What the full Titan valuation shows
Sign in free to see the complete Titan Company valuation
- ✓Fair value per share — from a ten-year discounted cash flow, every step shown
- ✓The Workbench — change revenue growth, the discount rate or terminal growth and watch Titan's value move
- ✓Bull, base and bear cases — and exactly which assumptions move between them
- ✓Peer comparison — against Trent, Avenue Supermarts, Kalyan Jewellers and HUL
- ✓Downloadable report — the full write-up, yours to keep
08Compare Titan Company with peers
The same valuation, run side by side.
Titan Company vs TrentBoth consumer retail, jewellery against fashion.→Titan Company vs Avenue SupermartsDiscretionary retail against everyday groceries.→Titan Company vs Kalyan JewellersThe closest listed jewellery comparison.→Titan Company vs Hindustan UnileverDiscretionary jewellery against everyday staples — the same consumer, different halves of the wallet.→Titan Company vs Maruti SuzukiTwo big-ticket discretionary purchases, both tied to the same income cycle.→09Questions people ask about Titan Company
Why is Titan's P/E so high?
The market is paying for a long runway: steady share gains from local jewellers, strong brands and high returns on capital. The DCF tests how long that growth has to last to justify the price.
How do gold prices affect Titan?
Higher gold prices lift reported revenue because the metal is part of the price, but they can slow buying and squeeze margins. Falling gold prices do the reverse.
Titan or Kalyan Jewellers — which is better value?
The two are compared on their own side-by-side page, on price, returns and what each share price assumes.
Is Titan Company overvalued?
At ₹4,845 the market is pricing in roughly 34% sustained growth, against the ~32% its own record supports. That is more than it has delivered, so the price is justified only if the business can hold a rate it has not previously sustained.
What is the intrinsic value of Titan Company?
It is computed from the filed financial statements using the method that fits this business (discounted cash flow), with every assumption shown alongside the result. The per-share figure and the full working are in the report.
How much debt does Titan Company carry?
Debt to equity stands at 0.01, against 0.00 at the start of the period — the balance sheet is a core input to the cost of capital used here.