On this page ▾
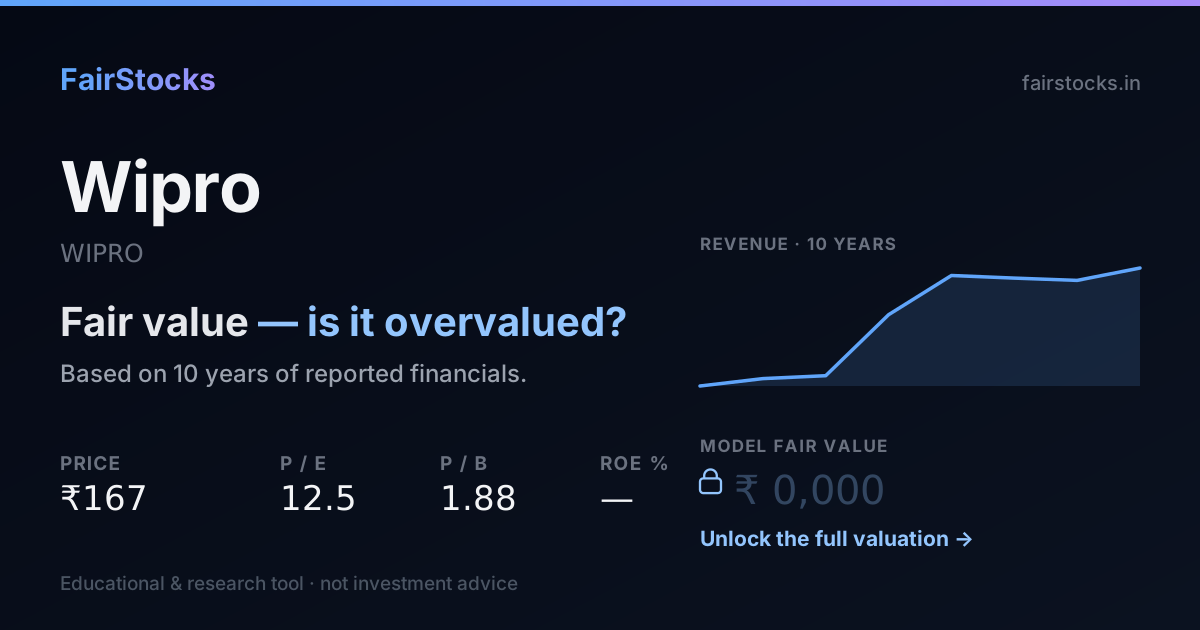
The market expects Wipro to carry on much as it has.
At today’s share price, buyers are assuming Wipro grows about 0% a year, forever. Over the last ten years it actually grew about 3% a year. The two are close, so the share price does not need the business to improve or to stumble. It needs it to keep doing roughly what it already does.
- How it is valued: Discounted cash flow.
- What the price assumes: 0% growth, against 3% the model takes from its own record.
- Ten-year record: Between FY2019 and FY2026, Wipro's revenue went from ₹59,019 crore to ₹92,624 crore — it compounded at about 7% a year over 7 years.
- Biggest swing factor: Deal wins. Main risk: Further slowdown.
01From vegetable oil to IT services
Wipro began as a vegetable-oil company in 1945 and became one of India's largest IT services firms under Azim Premji, whose family still owns the majority of its shares. It provides consulting, cloud, engineering and managed services to large companies, mostly in the US and Europe.
It bought Capco, a financial-services consultancy, in 2021 and has reorganised its business several times under successive chief executives. Its margins and growth have trailed TCS, Infosys and HCLTech, which is the gap the market is pricing.
02What the market is assuming
Work backwards from today's share price and you can see what buyers are quietly taking for granted. Here is the growth that price implies for Wipro, next to what the model assumes from the company's own record.
The further apart these two numbers are, the bigger the bet a buyer at today's price is making.
03Wipro's record, in plain numbers
Between FY2019 and FY2026, Wipro's revenue went from ₹59,019 crore to ₹92,624 crore — it compounded at about 7% a year over 7 years. Net profit grew from ₹9,018 crore to ₹13,266 crore, about 6% a year — roughly in step with revenue. In FY2026 it kept 14.3% of revenue as net profit — against a low of 12.4% in FY2024 and a high of 17.5% in FY2021. The latest year added 4.0% to revenue, close to its own long-run pace.
Revenue and earnings per share in ₹, return on equity and leverage as ratios — all from the filed statements.
Revenue and net profit by year (₹ crore)
| Year | Revenue | Net profit | Margin |
|---|---|---|---|
| FY2019 | 59,019 | 9,018 | 15.3% |
| FY2020 | 61,138 | 9,772 | 16.0% |
| FY2021 | 61,943 | 10,868 | 17.5% |
| FY2022 | 79,312 | 12,243 | 15.4% |
| FY2023 | 90,488 | 11,366 | 12.6% |
| FY2024 | 89,760 | 11,112 | 12.4% |
| FY2025 | 89,088 | 13,218 | 14.8% |
| FY2026 | 92,624 | 13,266 | 14.3% |
04How Wipro gets valued — and why
Discounted cash flowThis business is valued on the cash it is expected to generate, discounted back at its cost of capital — with growth taken from its own ten-year record rather than from guidance.
05What decides Wipro's value
Deal wins
Large contract wins are the clearest sign that growth is returning.
Consulting
Capco and other consulting work are discretionary and swing with client budgets.
Margins
Closing the margin gap with peers would add value even without faster growth.
Capital return
Wipro returns cash through dividends and buybacks.
06What could go wrong
- Further slowdown. Clients may keep shifting spending to larger rivals.
- Leadership changes. Frequent reorganisations can unsettle clients and staff.
- Currency. A stronger rupee lowers reported revenue and margins.
07What the full Wipro valuation shows
Sign in free to see the complete Wipro valuation
- ✓Fair value per share — from a ten-year discounted cash flow, every step shown
- ✓The Workbench — change revenue growth, the discount rate or terminal growth and watch Wipro's value move
- ✓Bull, base and bear cases — and exactly which assumptions move between them
- ✓Peer comparison — against TCS, Infosys and HCLTech on the same cash-flow model
- ✓Downloadable report — the full write-up, yours to keep
08Compare Wipro with peers
The same valuation, run side by side.
Wipro vs Tata Consultancy ServicesThe largest of the IT set, on the same cash-flow model.→Wipro vs InfosysThe nearest peer on size and client mix.→Wipro vs HCL TechnologiesComparable scale, a different margin profile.→09Questions people ask about Wipro
Why has Wipro grown more slowly than TCS and Infosys?
A weaker position in some fast-growing service lines, repeated reorganisations and exposure to discretionary consulting all played a part.
Is Wipro cheap compared with other IT stocks?
It trades on a lower multiple than its larger peers. Whether that is cheap depends on growth, which the cash-flow model tests.
Wipro or Infosys — which is better value?
Both are valued on the same cash-flow model; the comparison page sets them side by side.
Is Wipro overvalued?
At ₹198 the market is pricing in roughly 0% sustained growth, against the ~3% its own record supports. That is less than it has delivered — on these numbers the market is asking the business for less than its own record, which usually means it doubts the record repeats.
What is the intrinsic value of Wipro?
It is computed from the filed financial statements using the method that fits this business (discounted cash flow), with every assumption shown alongside the result. The per-share figure and the full working are in the report.
How much debt does Wipro carry?
Debt to equity stands at 0.00, down from 0.08 at the start of the period — the balance sheet is a core input to the cost of capital used here.